

Question: Problem 6-14 (similar to) Question Help (Expected return, standard deviation, and capital asset pricing model) The following are the end-of-month prices for both the Standard
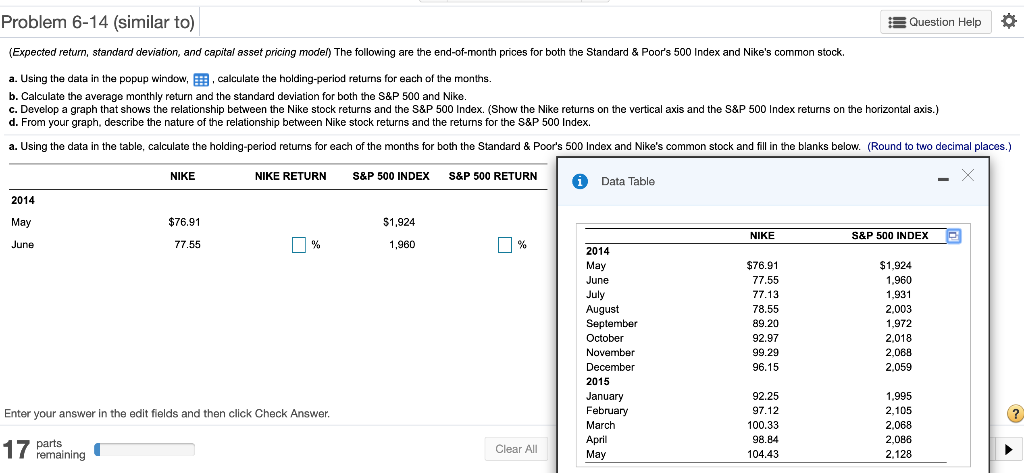
Problem 6-14 (similar to) Question Help (Expected return, standard deviation, and capital asset pricing model) The following are the end-of-month prices for both the Standard & Poor's 500 Index and Nike's common stock a. Using the data in the popup window, , calculate the holding-period returns for each of the months. b. Calculate the average monthly return and the standard deviation for both the S&P 500 and Nike c. Develop a graph that shows the relationship between the Nike stock returns and the S&P 500 Index. (Show the Nike returns on the vertical axis and the S&P 500 Index returns on the horizontal axis.) d. From your graph, describe the nature of the relationship between Nike stock returns and the returns for the S&P 500 Index. Poor's 500 Index and Nike's common stock and fill in the blanks below. (Round to two decimal places.) a. Using the data in the table, calculate the holding-period retums for each of the months for both the Standard S&P 500 INDEX S&P 500 RETURN NIKE NIKE RETURN Data Table 2014 May $76.91 $1.924 NIKE S&P 500 INDEX % % June 77.55 1,960 2014 May $76.91 $1,924 77.55 June 1.960 1.931 July 77.13 78.55 August September 2,003 89.20 1,972 cobel he December 96.15 2,059 2015 January 92,25 1.995 February March 97.12 2,105 Enter your answer in the edit fields and then click Check Answer. 100.33 2,068 April 98.84 2,086 parts remaining 17 Clear All May 104.43 2,128 Problem 6-14 (similar to) Question Help (Expected return, standard deviation, and capital asset pricing model) The following are the end-of-month prices for both the Standard & Poor's 500 Index and Nike's common stock a. Using the data in the popup window, , calculate the holding-period returns for each of the months. b. Calculate the average monthly return and the standard deviation for both the S&P 500 and Nike c. Develop a graph that shows the relationship between the Nike stock returns and the S&P 500 Index. (Show the Nike returns on the vertical axis and the S&P 500 Index returns on the horizontal axis.) d. From your graph, describe the nature of the relationship between Nike stock returns and the returns for the S&P 500 Index. Poor's 500 Index and Nike's common stock and fill in the blanks below. (Round to two decimal places.) a. Using the data in the table, calculate the holding-period retums for each of the months for both the Standard S&P 500 INDEX S&P 500 RETURN NIKE NIKE RETURN Data Table 2014 May $76.91 $1.924 NIKE S&P 500 INDEX % % June 77.55 1,960 2014 May $76.91 $1,924 77.55 June 1.960 1.931 July 77.13 78.55 August September 2,003 89.20 1,972 cobel he December 96.15 2,059 2015 January 92,25 1.995 February March 97.12 2,105 Enter your answer in the edit fields and then click Check Answer. 100.33 2,068 April 98.84 2,086 parts remaining 17 Clear All May 104.43 2,128
Step by Step Solution
There are 3 Steps involved in it

Get step-by-step solutions from verified subject matter experts