

Question: Experiment 1, Part 1: Changing Mass, Changing Amplitude Table 1: Varying Amplitude Number of 10 Oscillations (N) Mass 100 g Trial 1 Trial 2 Trial
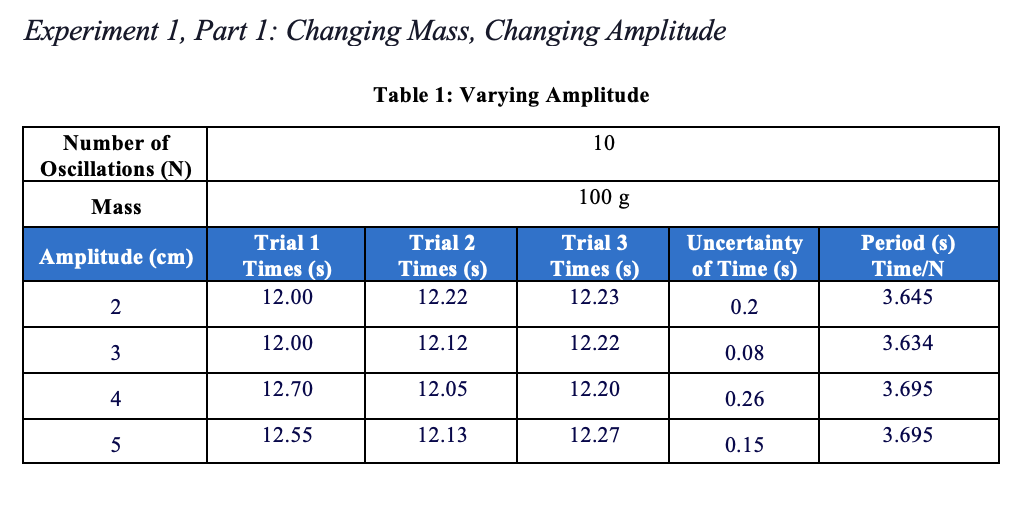
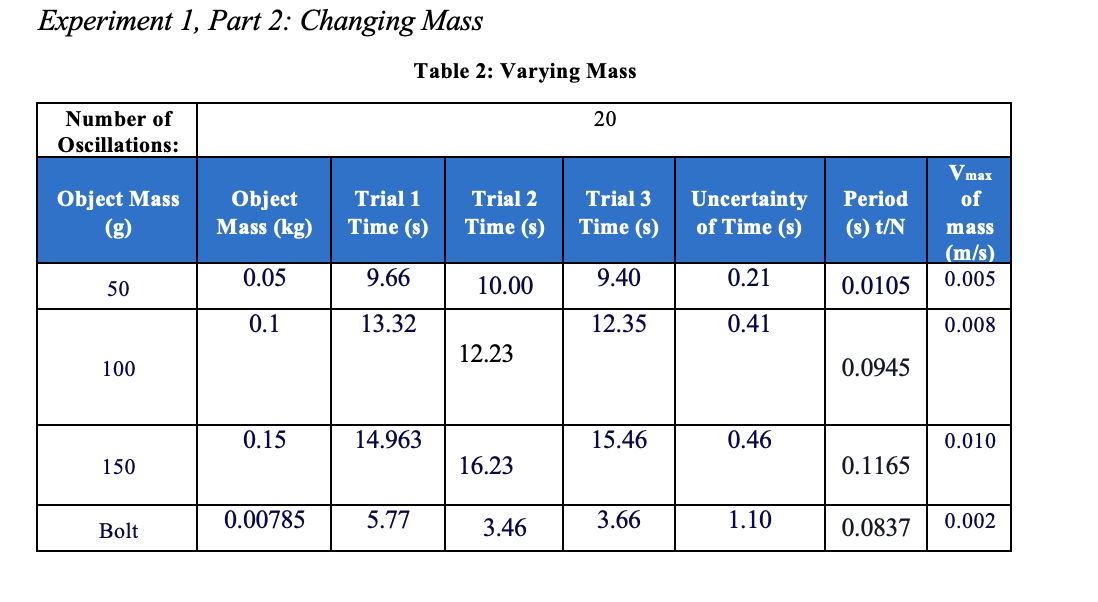


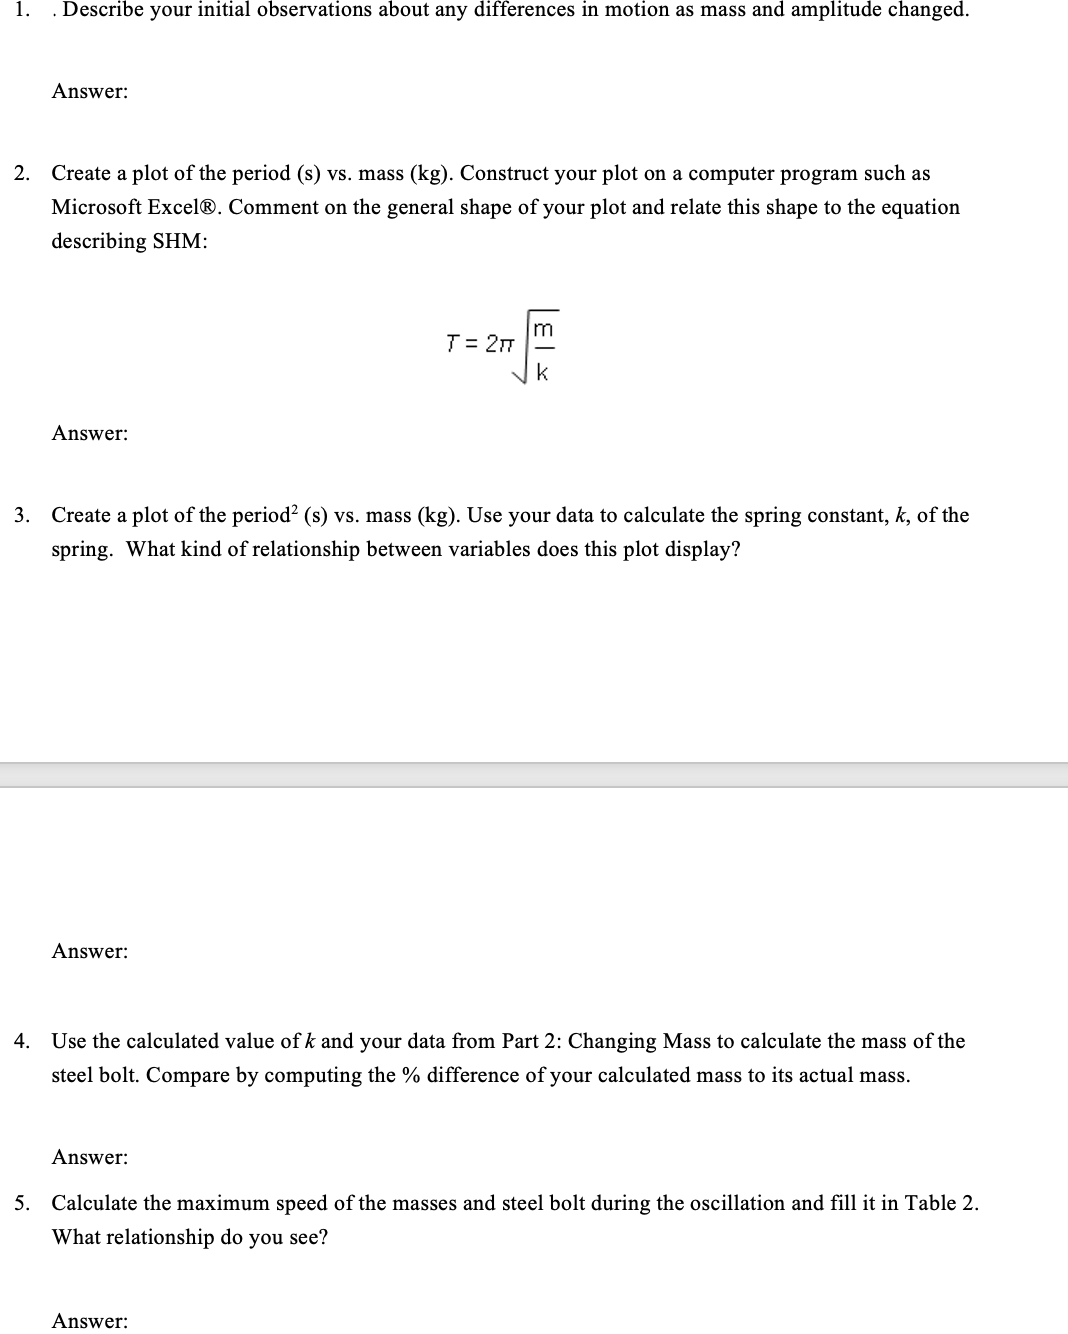
Experiment 1, Part 1: Changing Mass, Changing Amplitude Table 1: Varying Amplitude Number of 10 Oscillations (N) Mass 100 g Trial 1 Trial 2 Trial 3 Amplitude (cm) Uncertainty Period (s) Times (s) Times (s) Times (s) of Time (s) Time/N 2 12.00 12.22 12.23 0.2 3.645 12.00 12.12 12.22 0.08 3.634 4 12.70 12.05 12.20 0.26 3.695 5 12.55 12.13 12.27 0.15 3.695Experiment 1, Part 2: Changing Mass Table 2: Varying Mass Number of 20 Oscillations: Vmax Object Mass Object Trial 1 Trial 2 Trial 3 Uncertainty Period of (g Mass (kg) Time (s) Time (s) Time (s) of Time (s) (s) t/N mass (m/s) 50 0.05 9.66 10.00 9.40 0.21 0.0105 0.005 0.1 13.32 12.35 0.41 0.008 12.23 100 0.0945 0.15 14.963 15.46 0.46 0.010 150 16.23 0.1165 Bolt 0.00785 5.77 3.46 3.66 1.10 0.0837 0.002l. . Describe your initial observations about any differences in motion as mass and amplitude changed. Answer: 2. Create a plot of the period (s) vs. mass (kg). Construct your plot on a computer program such as Microsoft Excel. Comment on the general shape of your plot and relate this shape to the equation describing SHM: T 21': xlg Answer: 3. Create a plot of the period2 (s) vs. mass (kg). Use your data to calculate the spring constant, k, of the spring. What kind of relationship between variables does this plot display? Answer: 4. Use the calculated value ofk and your data from Part 2: Changing Mass to calculate the mass of the steel bolt. Compare by computing the % difference of your calculated mass to its actual mass. Answer: 5. Calculate the maximum speed of the masses and steel bolt during the oscillation and ll it in Table 2. What relationship do you see
Step by Step Solution
There are 3 Steps involved in it

Get step-by-step solutions from verified subject matter experts