

Question: EXPERIMENT # 2 : Analyze and draw the Shear force and Bending Moment Diagram for cantilever beam using SAP 2 0 0 0 . Objectives
EXPERIMENT # : Analyze and draw the Shear force and Bending Moment Diagram for cantilever beam using SAP
Objectives
To determine manually the reactions and draw shear force and bending moment diagram for cantilever beam.
To determine the reactions and draw shear force and bending moment diagram for cantilever beam using SAP program.
To compare the result of manual analysis and SAP
Theory:
A cantilever is a rigid structural element that extends horizontally and is unsupported at one end. Typically, it extends from a flat vertical surface such as a wall, to which it must be firmly attached.
Like other structural elements, a cantilever can be formed as a beam, plate, truss, or slab.
Shear force refers to the force that acts parallel to the crosssection of a structural element, while bending moment is the moment that occurs when an external force is applied to the element causing it to bend.
Equations of Static Equilibrium:
A structure is said to be in equilibrium, if it is initially at rest, so it will remain at rest when subjected to a system of forces and moments.
If a body is in equilibrium, then all its members and parts are also in equilibrium.
For the body or structure, to be in equilibrium, the following three equations must be satisfied.
EGCV Structural Analysis
Page
;;
Problem: A Cantilever beam of span is loaded with concentrated loads of intensity at free end and a uniformly distributed load of intensity over full span. Calculate the reactions at support and draw Shear force and Bending Moment diagram.
Step : Calculate the reactions using equilibrium equations.
Step : Calculate the shearforce ordinates at support and load points.
Step : Calculate the Bending moment values at support and load points.
Step : Draw the Shearforce and bending moment diagrams.
Step : Draw Shearforce and Bending moment diagrams Using SAP
Step : Compare the results of Manual calculation and SAP
Calculation:
EGCV Structural Analysis I
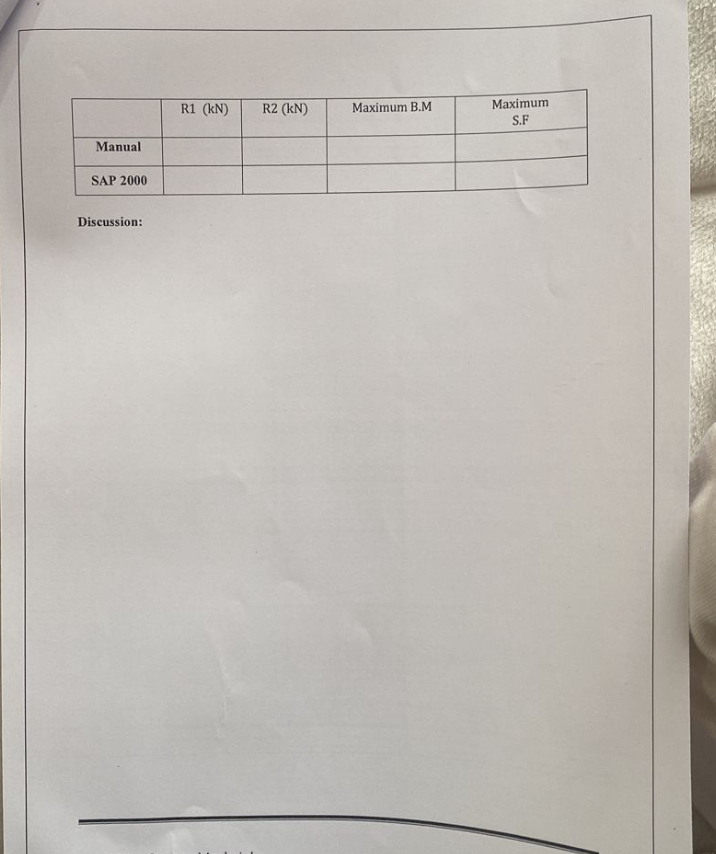
tableRkNRkNMaximum BMtableMaximumSFManualSAP
Discussion:
Step by Step Solution
There are 3 Steps involved in it
1 Expert Approved Answer
Step: 1 Unlock

Question Has Been Solved by an Expert!
Get step-by-step solutions from verified subject matter experts
Step: 2 Unlock
Step: 3 Unlock