

Question: EXPERIMENT 3: Create and save a graph of mass (y-axis) versus the volume (x-axis) for iron. Display the trendline. Determine the slope and intercept. The
EXPERIMENT 3: Create and save a graph of mass (y-axis) versus the volume (x-axis) for iron. Display the trendline. Determine the slope and intercept. The density equals the slope of the graph.
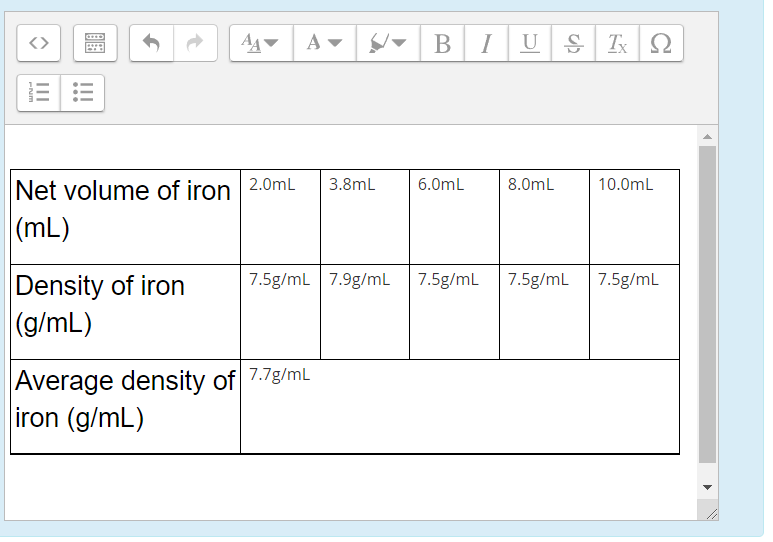
EXPERIMENT 3: Create and save a graph of mass (y-axis) versus the volume (x-axis) for iron. Display the trendline. Determine the slope and intercept. The density equals the slope of the graph.
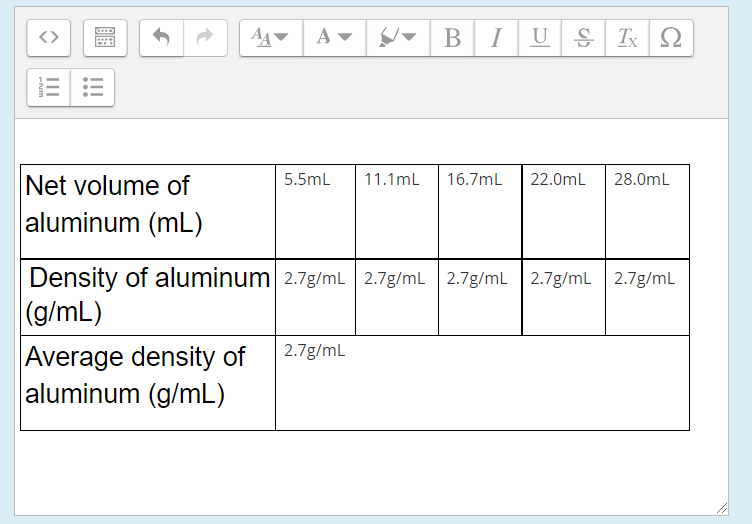
A B 1 U S TX 12 3.8mL 6.OmL 8.0mL 10.0mL Net volume of iron 2.0mL (mL) 7.5g/mL 7.9g/mL 7.5g/mL 7.5g/mL 7.5g/ml Density of iron (g/mL) Average density of 7.7g/mL iron (g/mL) O B 1 U S Tx 22 WN III III 5.5mL 11.1mL 16.7mL 22.0mL 28.0mL Net volume of aluminum (mL) 2.7g/mL Density of aluminum 2.7g/ml | 2.7g/mL 2.7g/mL 2.7g/mL (g/mL) Average density of 2.7g/mL aluminum (g/mL)
Step by Step Solution
There are 3 Steps involved in it

Get step-by-step solutions from verified subject matter experts