

Question: there is no need to draw the graph. just need the questions on the bottom answered. the slope, y-intercept and equation for line of best
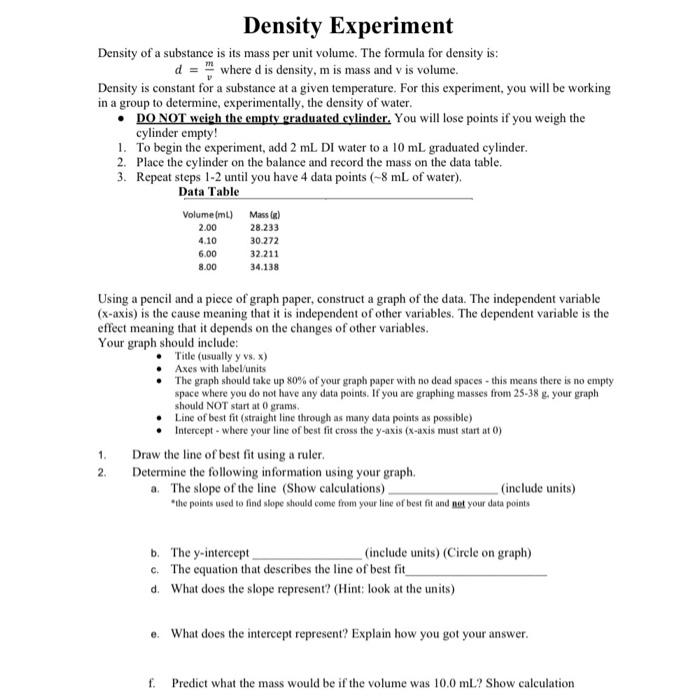
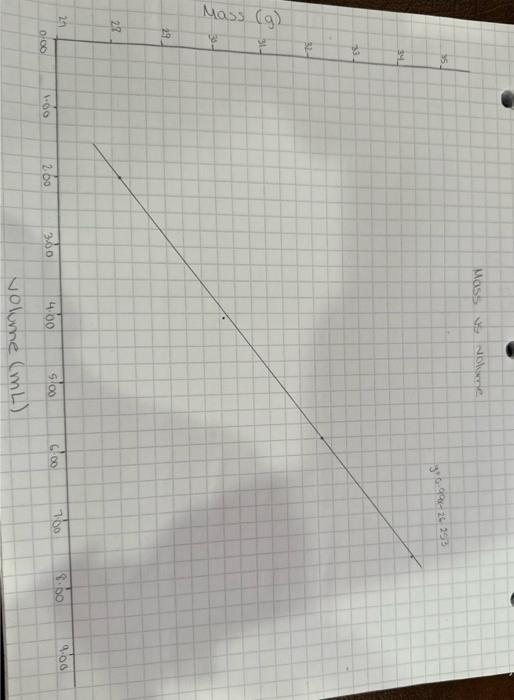
Density Experiment Density of a substance is its mass per unit volume. The formula for density is: d=vmwheredisdensity,mismassandvisvolume. Density is constant for a substance at a given temperature. For this experiment, you will be working in a group to determine, experimentally, the density of water. - DO NOT weigh the empty graduated cylinder. You will lose points if you weigh the cylinder empty! 1. To begin the experiment, add 2mL DI water to a 10mL graduated cylinder. 2. Place the cylinder on the balance and record the mass on the data table. 3. Repeat steps 1-2 until you have 4 data points (8mL of water). Data Table Using a pencil and a piece of graph paper, construct a graph of the data. The independent variable ( x-axis) is the cause meaning that it is independent of other variables. The dependent variable is the effect meaning that it depends on the changes of other variables. Your graph should include: - Title (usually y vs. x) - Axes with label/units - The graph should take up 80% of your graph paper with no dead spaces - this means there is no empty space where you do not have any data points. If you are graphing masses from 2538 \& your graph should NOT start at 0 grams. - Line of best fit (straight line through as many data points as possible) - Intercept - where your line of best fit cross the y-axis ( x-axis must start at 0 ) 1. Draw the line of best fit using a ruler. 2. Determine the following information using your graph. a. The slope of the line (Show calculations) (include units) *the points used to find slope should come from your line of best fit and not your data points b. The y-intercept (include units) (Circle on graph) c. The equation that describes the line of best fit d. What does the slope represent? (Hint: look at the units) e. What does the intercept represent? Explain how you got your answer. f. Predict what the mass would be if the volume was 10.0mL ? Show calculation
Step by Step Solution
There are 3 Steps involved in it

Get step-by-step solutions from verified subject matter experts