

Question: Please use the below data that I obtained from my lab and please kindly help with questions 2-5 and the observations/conclusion/interpretation of results please. The
Please use the below data that I obtained from my lab and please kindly help with questions 2-5 and the observations/conclusion/interpretation of results please.
The aim of this experiment is to identify the defining characteristics of acids and bases, to define acidity and explain how the pH scale relates to the acidity of a substance, to distinguish between strong and weak acids in relationship to the acid ionization constant (Ka), and to discuss the purpose of a pH titration curve and define the half-equivalence point and equivalence point. In so doing, we will perform pH analysis utilizing pH indicator strips, perform a titration of a weak acid against a strong base, construct an accurate titration curve using experimental results, and determine Ka for an unknown weak acid utilizing the data collected during the experiment.
Results
Experimental data (these can also be organized in a table or graph):
Calculations:
Experiment 1
Data Table 1: Determination of Equivalence Point
Trial 1 | Trial 2 | |
Volume of Unknown Weak Acid | 4 ml | 4 ml |
Total Number of Drops Required to Reach Equivalence Point | 110 | 110 |
Average Number of Drops | 110 | |
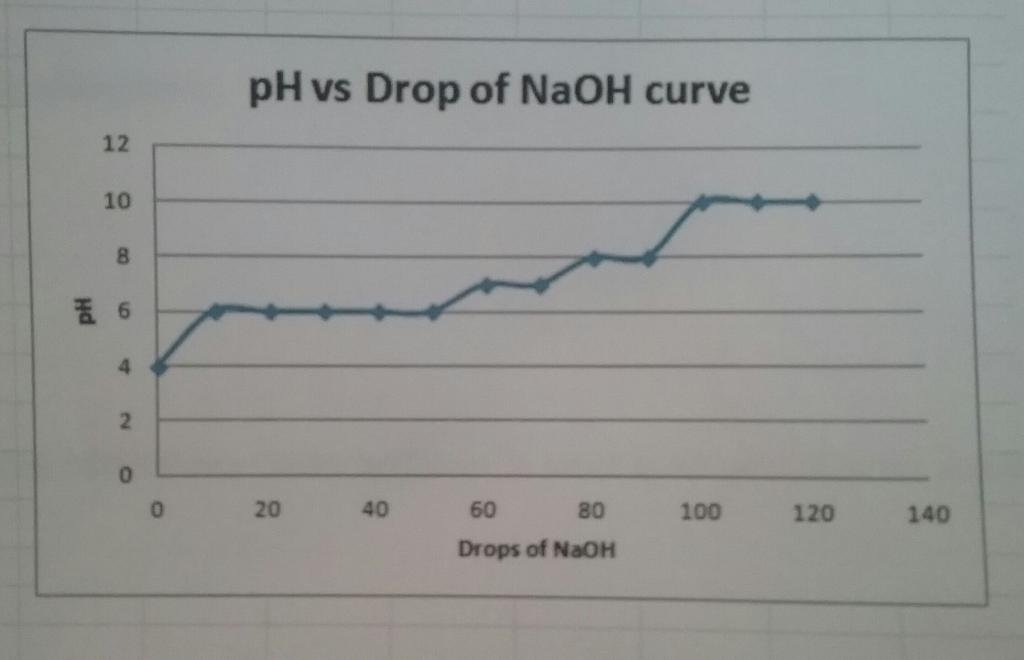
Data Table 2: Titration Curve Values
Drops NaOH Added | pH Value Trial 1 | pH Value Trial 2 | pH Value (Average) |
Half-Equivalent Point | 55 | 55 | 55 |
Equivalent Point | 110 | 110 | 110 |
0 | 4 | 4 | 4 |
10 | 6 | 6 | 6 |
20 | 6 | 6 | 6 |
30 | 6 | 6 | 6 |
40 | 6 | 6 | 6 |
50 | 6 | 6 | 6 |
60 | 7 | 7 | 7 |
70 | 7 | 7 | 7 |
80 | 8 | 8 | 8 |
90 | 8 | 8 | 8 |
100 | 10 | 10 | 10 |
110 | 10 | 10 | 10 |
120 | 10 | 10 | 10 |
Panel 1: Equivalent Point Number of Drops
46 Drops of NaOH
Panel 2: Half-Equivalent Point Number of Drops
93 Drops of NaOH
Data Table 3: Determination of Unknown
pKa of Unknown Weak Acid: | 6.0 |
Ka of Unknown Weak Acid: | 10-6 |
Unknown Weak Acid Identity: | Carbonic acid (H2CO3 |
% Error pKa: | 5.81% |
% Error Ka: | 132.56% |
pH indicator strips work by changing color in the presence of solutions with varied pH values. Thinking about your procedure steps and results in Part 1, why do you think the pH of the unknown weak acid was not determined with pH indicator strips until Part 2?
Discuss possible causes of error in the experimental procedure. Why do you think there was a percent of error in the pKa and Ka values of the unknown weak acid, in comparison to the values presented in Table 2?
Do you think using a pH meter instead of pH indicator strips would have created a larger or smaller percent error? Explain your answer.
5. Why was phenolphthalein a good indicator to use for determining the equivalence point between the unknown weak acid and strong base?
12 10 8 6 et 4 2 0 0 pH vs Drop of NaOH curve 20 40 60 80 Drops of NaOH 100 120 140
Step by Step Solution
There are 3 Steps involved in it
2 Thinking about your procedure steps and results in Part 1 why do you think the pH of t... View full answer

Get step-by-step solutions from verified subject matter experts