

Question: experiment- Freezing point depression. I need help with the data portion of the lab. Please be detailed and answer the sections. I appreciate any help
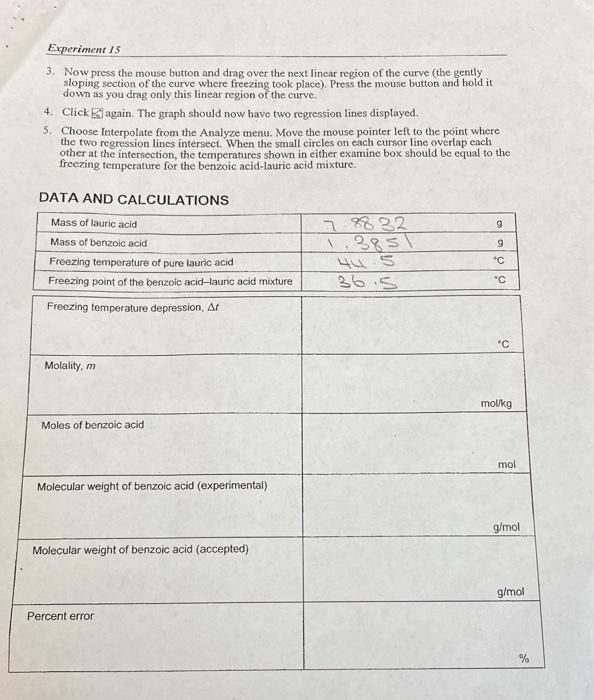
3. Now press the mouse button and drag over the next linear region of the curve (the gently sloping section of the curve where freezing took place). Press the mouse button and hold it down as you drag only this linear region of the curve. 4. Click E again. The graph should now have two regression lines displayed. 5. Choose Interpolate from the Analyze menu. Move the mouse pointer left to the point where the two regression lines intersect. When the small circles on each cursor line overlap each other at the intersection, the temperatures shown in either examine box should be equal to the freezing temperature for the benzoic acid-lauric acid mixture
Step by Step Solution
There are 3 Steps involved in it

Get step-by-step solutions from verified subject matter experts