

Question: Expert solution Solution Requirements Utilize Microsoft Excel to complete the following steps: Draw the project network diagram. Calculate the expected activity time, standard deviation, and
Expert solution
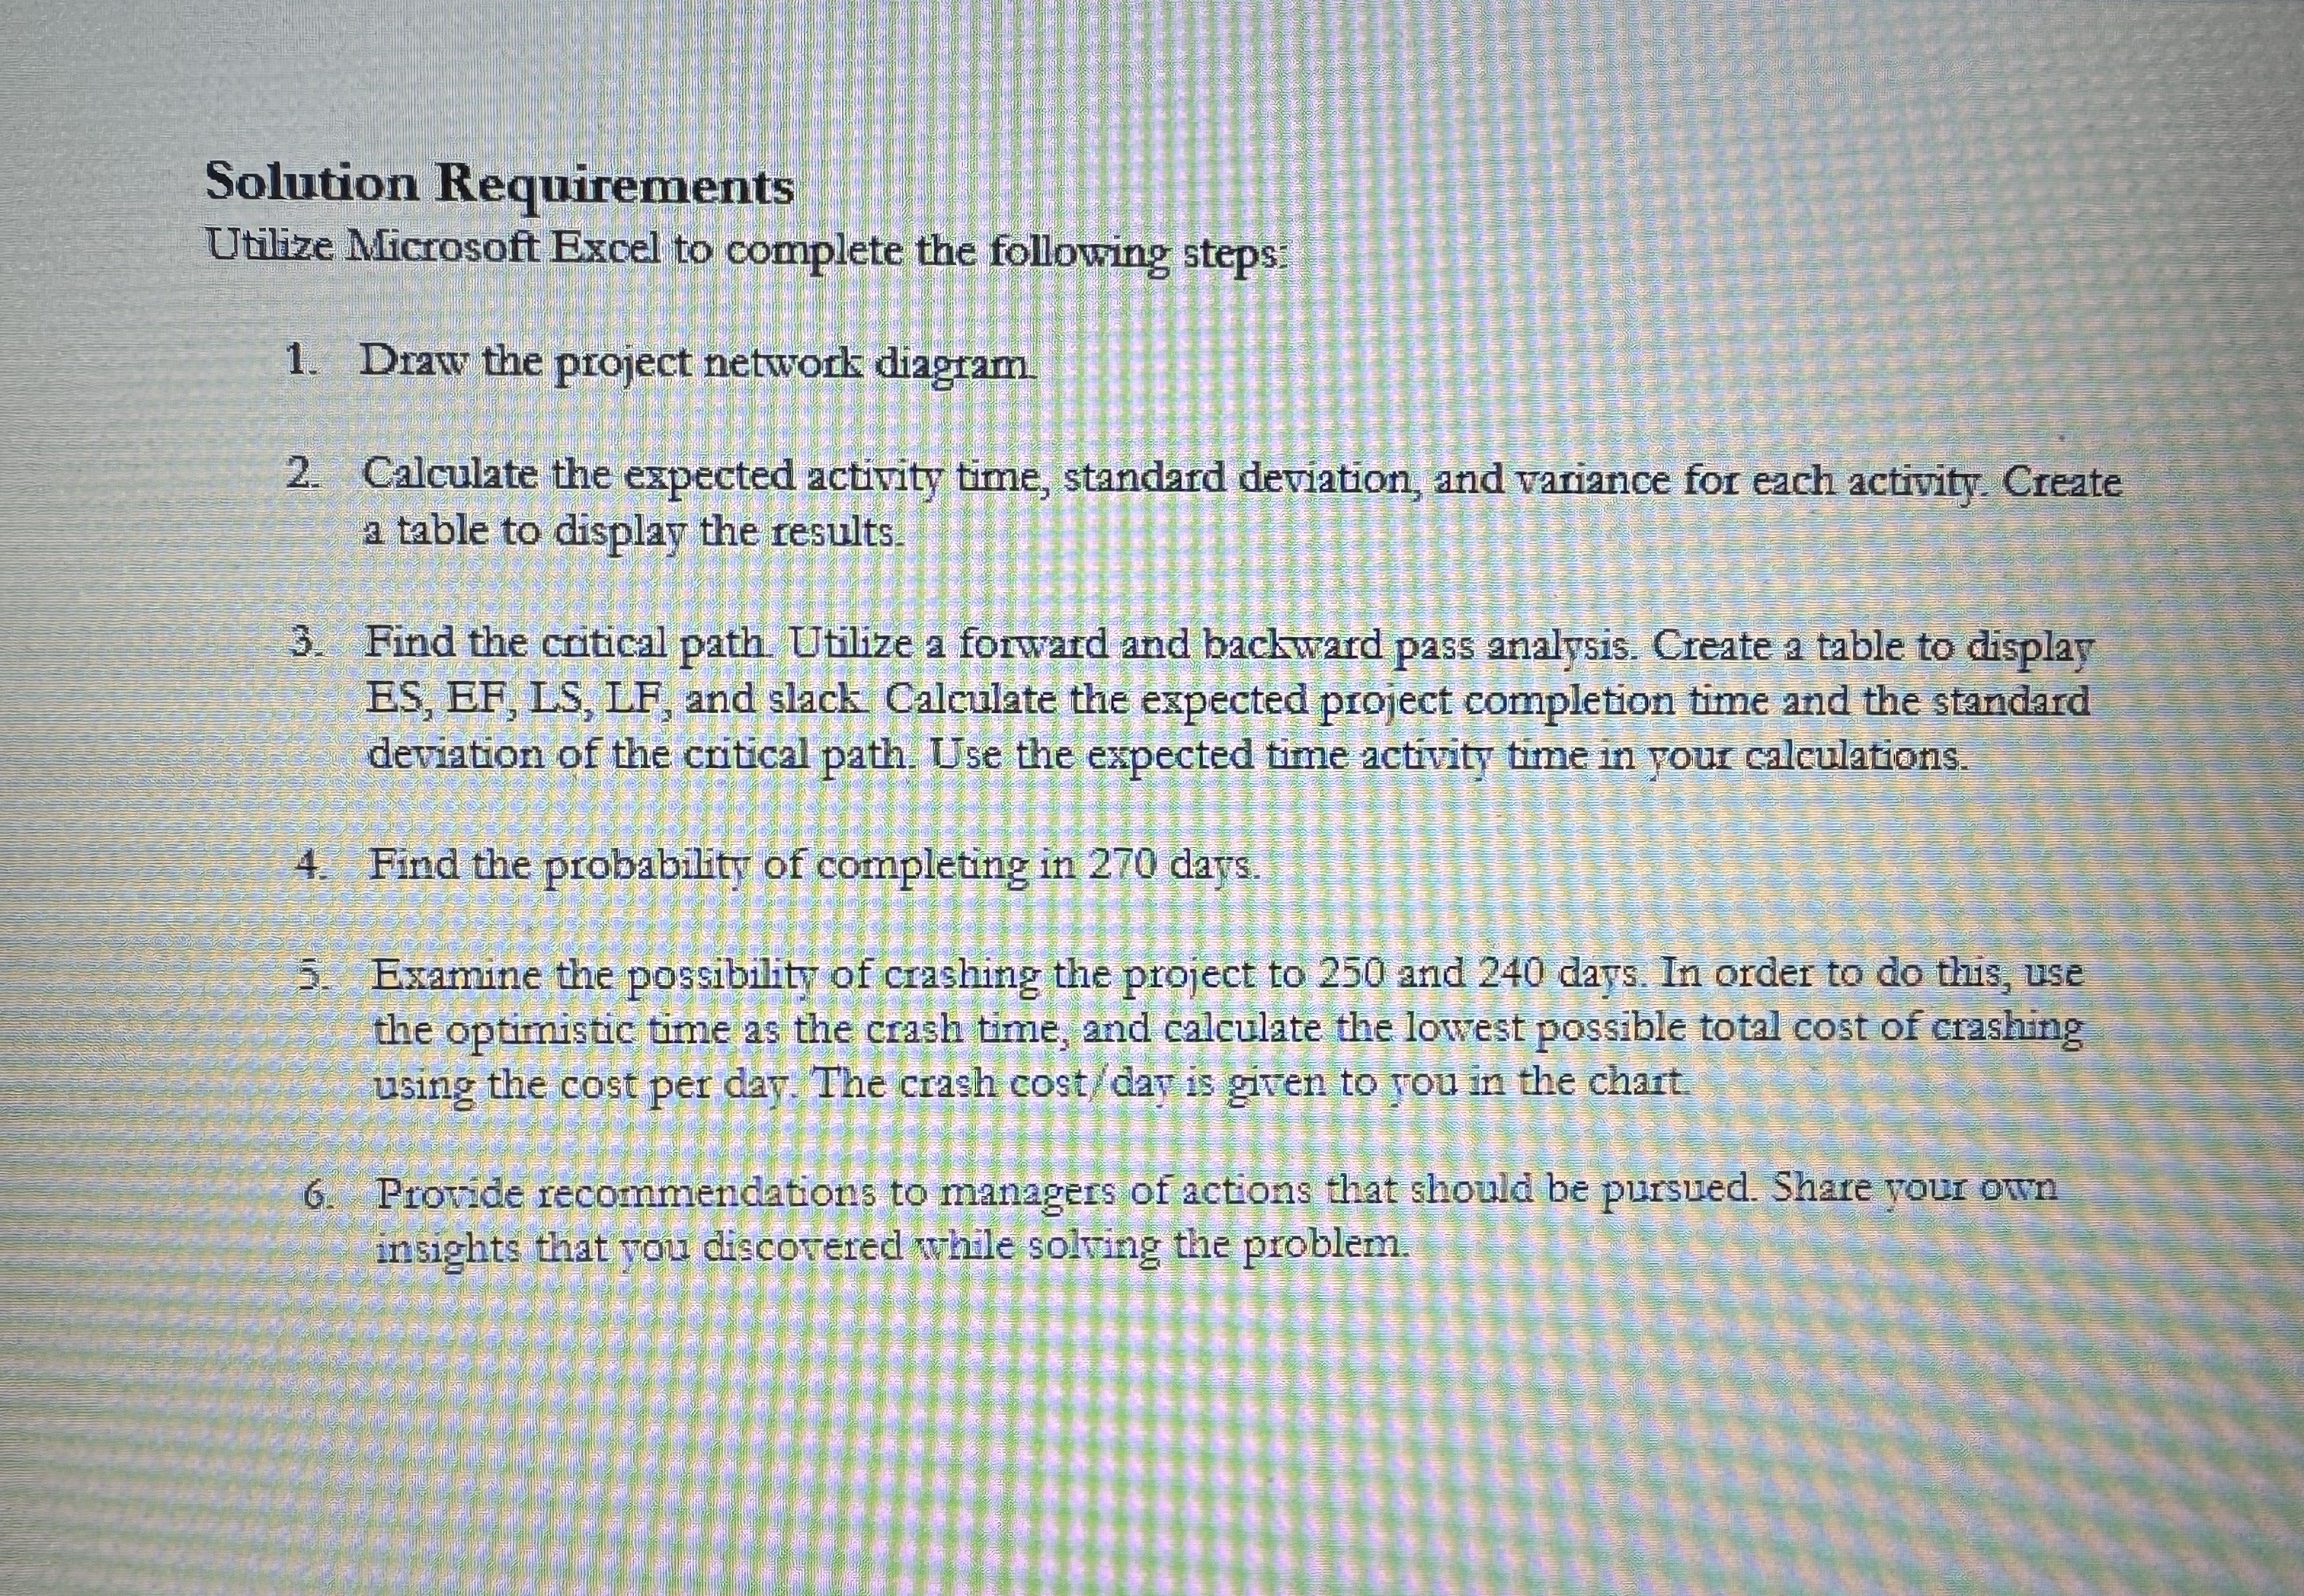
Solution Requirements
Utilize Microsoft Excel to complete the following steps:
Draw the project network diagram.
Calculate the expected activity time, standard deviation, and variance for each activity. Create a table to display the results.
Find the critical path. Utilize a forward and backward pass analysis. Create a table to display ES EF LS LF and slack Calculate the expected project completion time and the standard deviation of the critical path. Use the expected time activity time in your calculations.
Find the probability of completing in days.
Examine the possibility of crashing the project to and days. In order to do this, use the optimistic time as the crash time, and calculate the lowest possible total cost of crashing using the cost per day. The crash costday is given to you in the chart.
Provide recommendations to managers of actions that should be pursued. Share your own insights that you discovered while solving the problem.
Step by Step Solution
There are 3 Steps involved in it
1 Expert Approved Answer
Step: 1 Unlock

Question Has Been Solved by an Expert!
Get step-by-step solutions from verified subject matter experts
Step: 2 Unlock
Step: 3 Unlock