

Question: explain and show how the equation was obtained based from the sets of data given 7. The following surface tensions were measured for aqueous solutions
explain and show how the equation was obtained based from the sets of data given 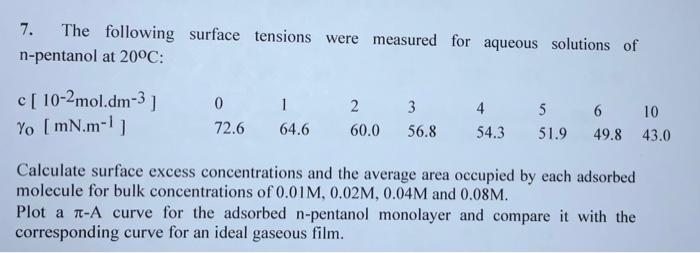
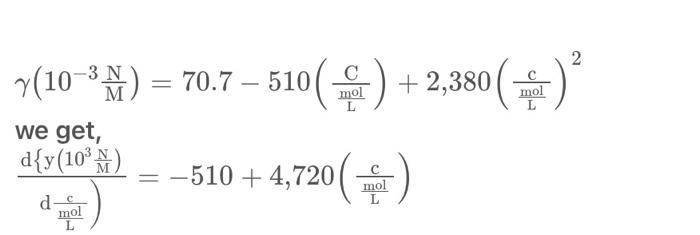
7. The following surface tensions were measured for aqueous solutions of n-pentanol at 20C: Calculate surface excess concentrations and the average area occupied by each adsorbed molecule for bulk concentrations of 0.01M,0.02M,0.04M and 0.08M. Plot a A curve for the adsorbed n-pentanol monolayer and compare it with the corresponding curve for an ideal gaseous film. (103MN)=70.7510(LmolC)+2,380(LmolC)2 we get
Step by Step Solution
There are 3 Steps involved in it
1 Expert Approved Answer
Step: 1 Unlock

Question Has Been Solved by an Expert!
Get step-by-step solutions from verified subject matter experts
Step: 2 Unlock
Step: 3 Unlock