

Question: explain and show how the equation shown in a was obtained based from the set of datas. equation was supposedly used to Calculate surface excess
explain and show how the equation shown in a was obtained based from the set of datas.
equation was supposedly used to Calculate surface excess concentrations and the average area occupied by each adsorbed molecule for bulk concentrations 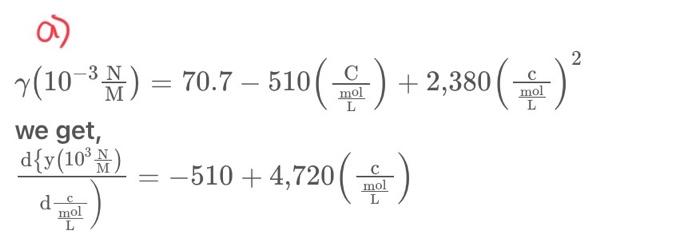
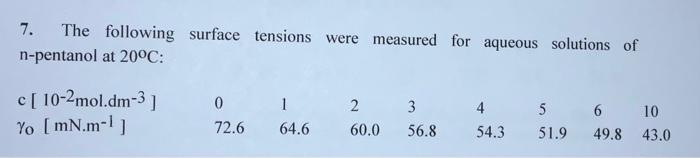
(103MN)=70.7510(LmolC)+2,380(Lmolc)2 we get, dLmolc)d{y(103MN)=510+4,720(Lmolc) 7. The following surface tensions were measured for aqueous solutions of n-pentanol at 20C
Step by Step Solution
There are 3 Steps involved in it
1 Expert Approved Answer
Step: 1 Unlock

Question Has Been Solved by an Expert!
Get step-by-step solutions from verified subject matter experts
Step: 2 Unlock
Step: 3 Unlock