

Question: Explain based on the graph above: 1. Explain candlestick in the graph above 2. Explain the support and resistance (blue line) 3. Explain trendline (purple
Explain based on the graph above:
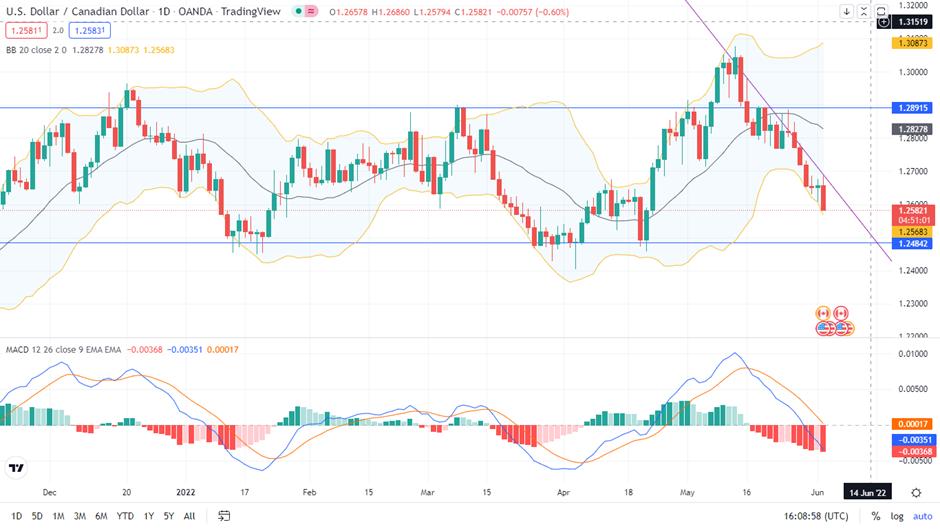
1. Explain candlestick in the graph above
2. Explain the support and resistance (blue line)
3. Explain trendline (purple line)
4. Explain MACD in the graph
5. Explain Bollinger Band based on the graph above
Must make a recommendation to go long OR go short on USDCAD (graph above) stating what price to buy/sell and the target price.
U.S. Dollar Canadian Dollar 1D OANDA - TradingView 1.25811 2.0 1.25831 BB 20 close 2.0 1.28278 1.30873 1.25683 MACD 12 26 close 9 EMA EMA -0.00368 -0.00351 0.00017 Dec 20 01.26578 H1.26860 LT-25794 C1.25821 -0.00757 (-0.60%) 1.32000 1.31519 1.30873 2022 17 Feb 15 Mar 15 Apr 18 May 16 1D 5D 1M 3M 6M YTD 1Y 5Y All 1.30000 1.28915 1.28278 1.28000 1.27000 36000 1.25821 04:51:01 1.25683 1.24842 1.24000 1.23000 132000 0.01000 0.00500 0.00017 -0.00351 -0.00368 -0.00500 Jun 14 Jun 22 16:08:58 (UTC) % log auto
Step by Step Solution
3.49 Rating (149 Votes )
There are 3 Steps involved in it
Based on the graph you sent heres an explanation of the technical indicators Candlestick A candlestick is a way to depict price movement over a specific period on a chart The body of the candlestick s... View full answer

Get step-by-step solutions from verified subject matter experts