

Question: Explain changes in NET MARGIN for Disney from year to year using the concepts and theories listed below (a list to choose from below). Make
Explain changes in NET MARGIN for Disney from year to year using the concepts and theories listed below (a list to choose from below). Make sure you consider the mergers and acquisitions that Disney made and alliances that Disney entered. How did they affect Disneys performance from year to year? Bullet points are preferred.
Concepts/Theories
Competitive Attack
First-mover
Late-Mover
Horizontal Merger and Acquisition
Vertical Integration Strategies
Outsourcing
Porter's Diamond of National Competitive Advantage
Exchange rate shifts
Impact of Government Policies and Economic Conditions in Host Countries
Cross-country cultural or market conditions
Entering and Competing in International Markets
International Multi-domestic strategy
International Global Strategy
International Transnational Strategy
Using location to build competitive advantage
Profit Sanctuaries and Cross-Border strategic moves
Business Diversification
Building Shareholder
Business Diversification
Ethical Universalism
Ethical Relativism
Ethical standards for strategy
Corporate Social Responsibility
Environmental Sustainability
Strategic Vision
Competitive Weapons
Competitive Pressure
Company's competitively important resources and capabilities
Competitive deficiencies
Company internal strengths
Value chain activities/competitiveness
Low cost provider competitive strategy
Broad differentiation competitive strategy
Focused low cost competitive strategy
Focused differentiation competitive strategy
Best cost provider competitive strategy
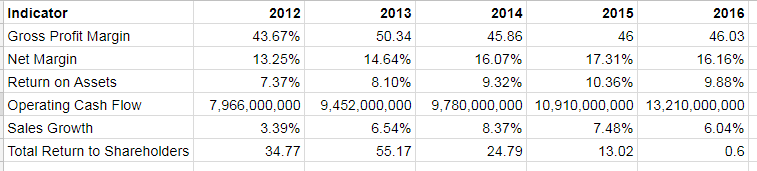
Indicator Gross Profit Margin Net Margin Return on Assets Operating Cash Flow Sales Growth Total Return to Shareholders 2016 46.03 16.16% 9.88% 7,966,000,000 9,452,000,000 9.780,000,000 10,910,00,000 13,210,000,000 6.04% 0.6 2012 43.67% 13.25% 7 37% 2013 50.34 14.64% 81 0% 2014 45.86 16.07% 9.32% 2015 46 17.31% 10.36% 3.39% 6.54% 8.37% 7.48% 34.77 55.17 24.79 13.02
Step by Step Solution
There are 3 Steps involved in it

Get step-by-step solutions from verified subject matter experts