

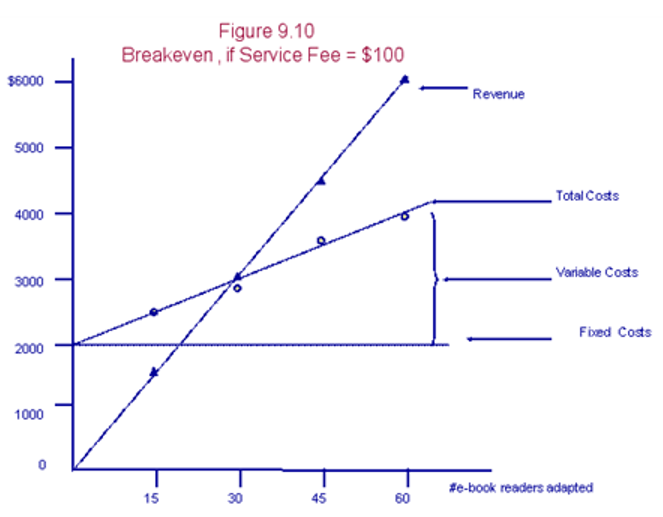
Question: Explain each part of this graph and how it relates to costing and pricing? Figure 9.10 Breakeven if Service Fee = $100 $6000 Revenue 5000
Explain each part of this graph and how it relates to costing and pricing?
Step by Step Solution
There are 3 Steps involved in it
1 Expert Approved Answer
Step: 1 Unlock

Question Has Been Solved by an Expert!
Get step-by-step solutions from verified subject matter experts
Step: 2 Unlock
Step: 3 Unlock