

Question: Is dotted line a good fit to the data in the following graph? [There are 2 correct answers] Good Fit? y0.0002 - 0.0132x 0.2675x-
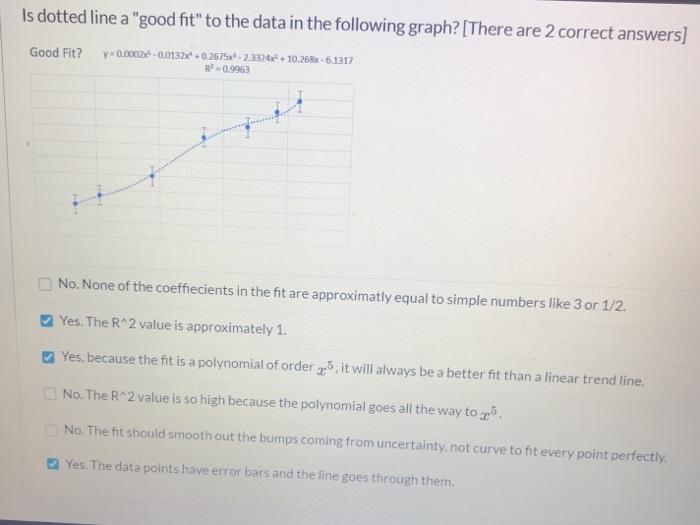
Is dotted line a "good fit" to the data in the following graph? [There are 2 correct answers] Good Fit? y0.0002 - 0.0132x 0.2675x- 23324 + 10.268x - 6.1317 R0.9963 O No. None of the coeffiecients in the fit are approximatly equal to simple numbers like 3 or 1/2. Yes. The R 2 value is approximately 1. Yes, because the fit is a polynomial of order 5, it will always be a better fit than a linear trend line. O No. The R^2 value is so high because the polynomial goes all the way to 5. O No. The fit should smooth out the bumps coming from uncertainty, not curve to fit every point perfectly. Yes. The data points have error bars and the line goes through them.
Step by Step Solution
3.39 Rating (146 Votes )
There are 3 Steps involved in it
The answer is 1 No The R2 value is so h... View full answer

Get step-by-step solutions from verified subject matter experts