

Question: Explain how the two graphs are related. Please, give a detailed explanation. I don't understand what you saying but, the two graphs are different. 1
Explain how the two graphs are related. Please, give a detailed explanation.
I don't understand what you saying but, the two graphs are different. 1 is a clustered column chart while the other is just a column graph.
So, I just need you to explain how the two graphs are related.
Please, carefully study the graph and the sentence before the graphs.
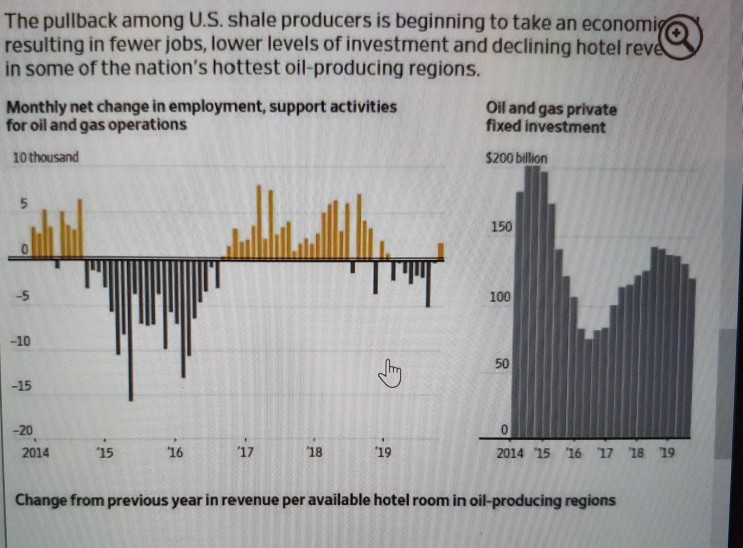
The pullback among U.S. shale producers is beginning to take an economis resulting in fewer jobs, lower levels of investment and declining hotel reve in some of the nation's hottest oil-producing regions. Monthly net change in employment, support activities for oil and gas operations 10 thousand Oil and gas private fixed investment $200 billion 150 -15 -20 2014 '15 16 17 18 2014 15 16 17 18 19 Change from previous year in revenue per available hotel room in oil-producing regions
Step by Step Solution
There are 3 Steps involved in it

Get step-by-step solutions from verified subject matter experts