

Question: Explain how they get this A table of values for a linear function is shown. x |f(x) -1 -8 3 0 6 6 Match each
Explain how they get this
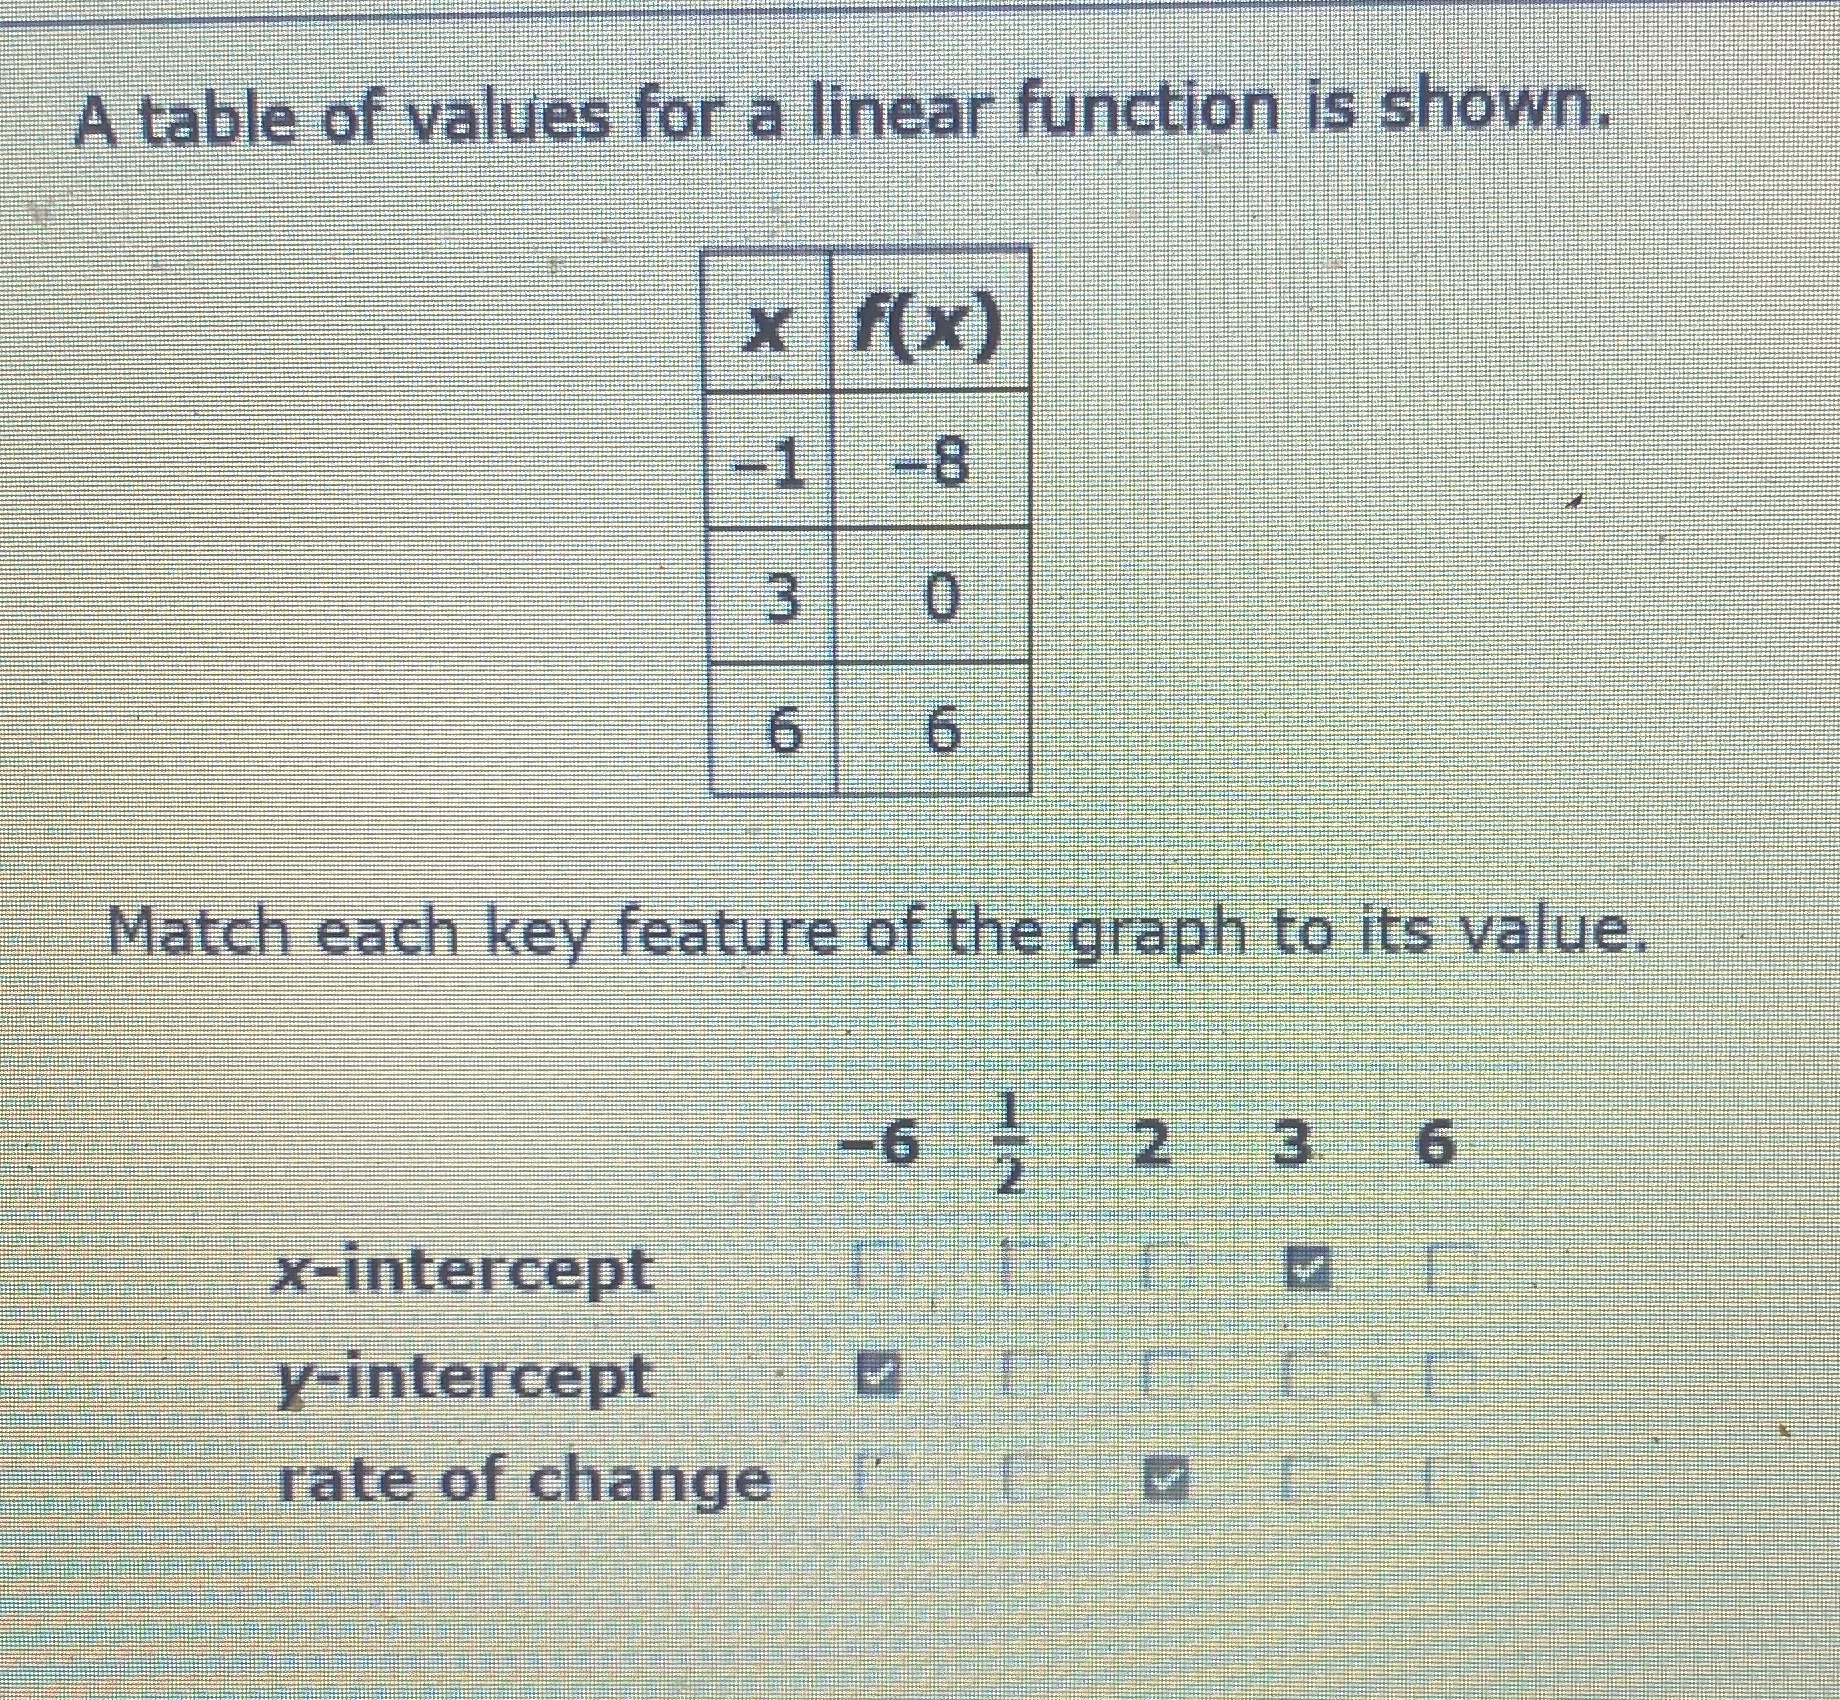
A table of values for a linear function is shown. x |f(x) -1 -8 3 0 6 6 Match each key feature of the graph to its value. -6 2 3 6 x-intercept Y-intercept rate of change
Step by Step Solution
There are 3 Steps involved in it
1 Expert Approved Answer
Step: 1 Unlock

Question Has Been Solved by an Expert!
Get step-by-step solutions from verified subject matter experts
Step: 2 Unlock
Step: 3 Unlock