

Question: explain how this plot explains how the electric field is stronger in the middle and weaker at the edges. fContour plot for point and line
explain how this plot explains how the electric field is stronger in the middle and weaker at the edges.
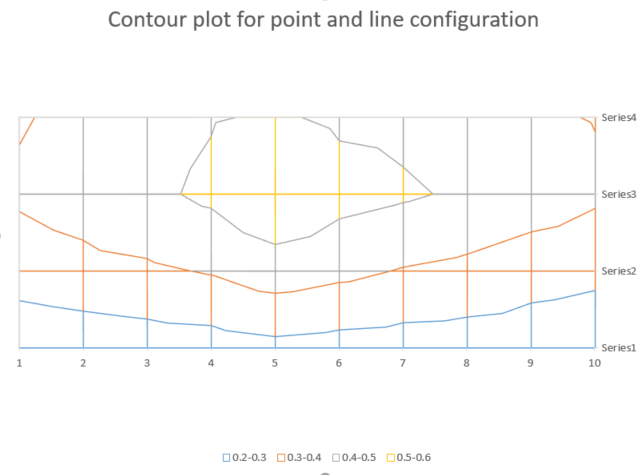
\fContour plot for point and line configuration Series4 Series3 Series2 Series1 2 3 4 5 6 7 8 9 10 [0.2-0.3 0.3-0.4 00.4-0.5 00.5-0.6
Step by Step Solution
There are 3 Steps involved in it
1 Expert Approved Answer
Step: 1 Unlock

Question Has Been Solved by an Expert!
Get step-by-step solutions from verified subject matter experts
Step: 2 Unlock
Step: 3 Unlock