

Question: Explain how to get it 4. The graph below represents f(x). 18 15 14 -13 12- -6 -5 -3 5 What are the x-intercept(s) of
Explain how to get it
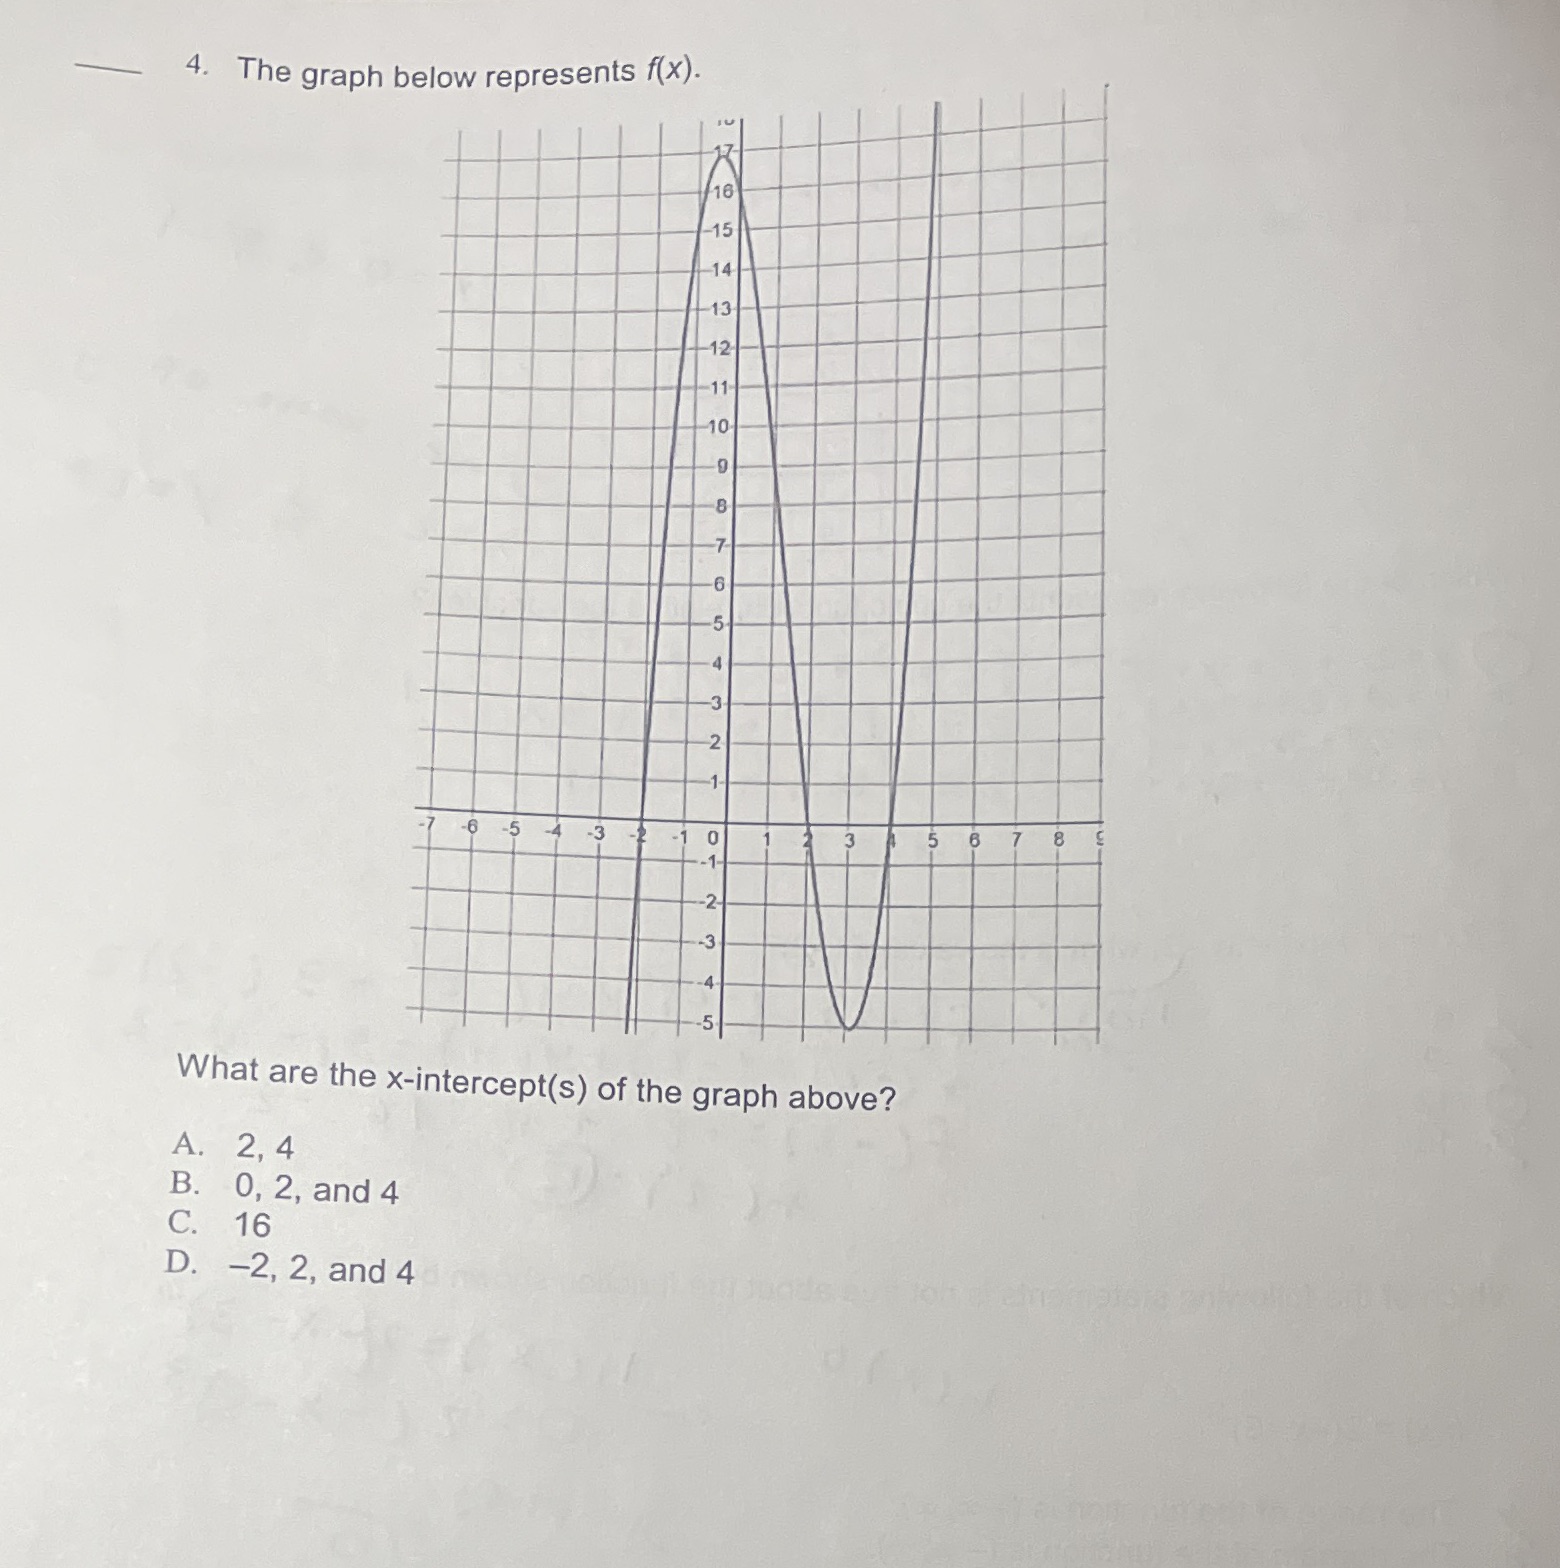
4. The graph below represents f(x). 18 15 14 -13 12- -6 -5 -3 5 What are the x-intercept(s) of the graph above? A. 2, 4 B. 0, 2, and 4 C. 16 D. -2, 2, and 4
Step by Step Solution
There are 3 Steps involved in it
1 Expert Approved Answer
Step: 1 Unlock

Question Has Been Solved by an Expert!
Get step-by-step solutions from verified subject matter experts
Step: 2 Unlock
Step: 3 Unlock