

Question: This discussion is on Pink Chapter 13. Use the excel spreadsheet associated with this chapter in your response. Your response should have 500+ words, else
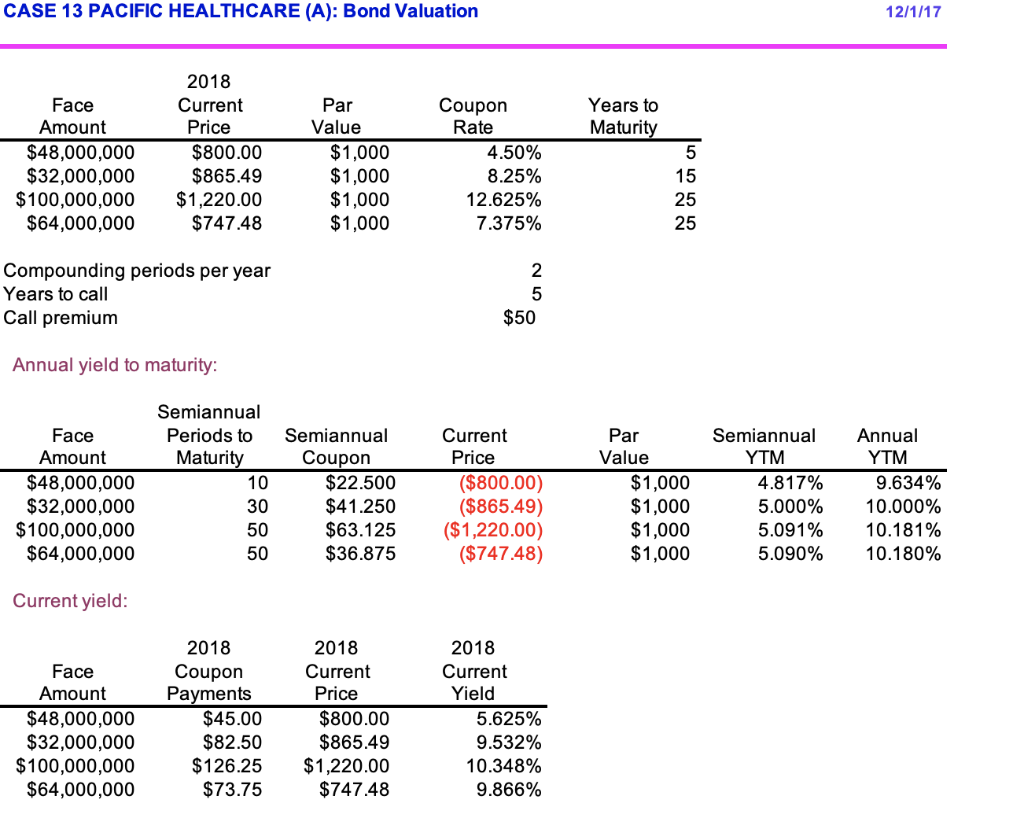
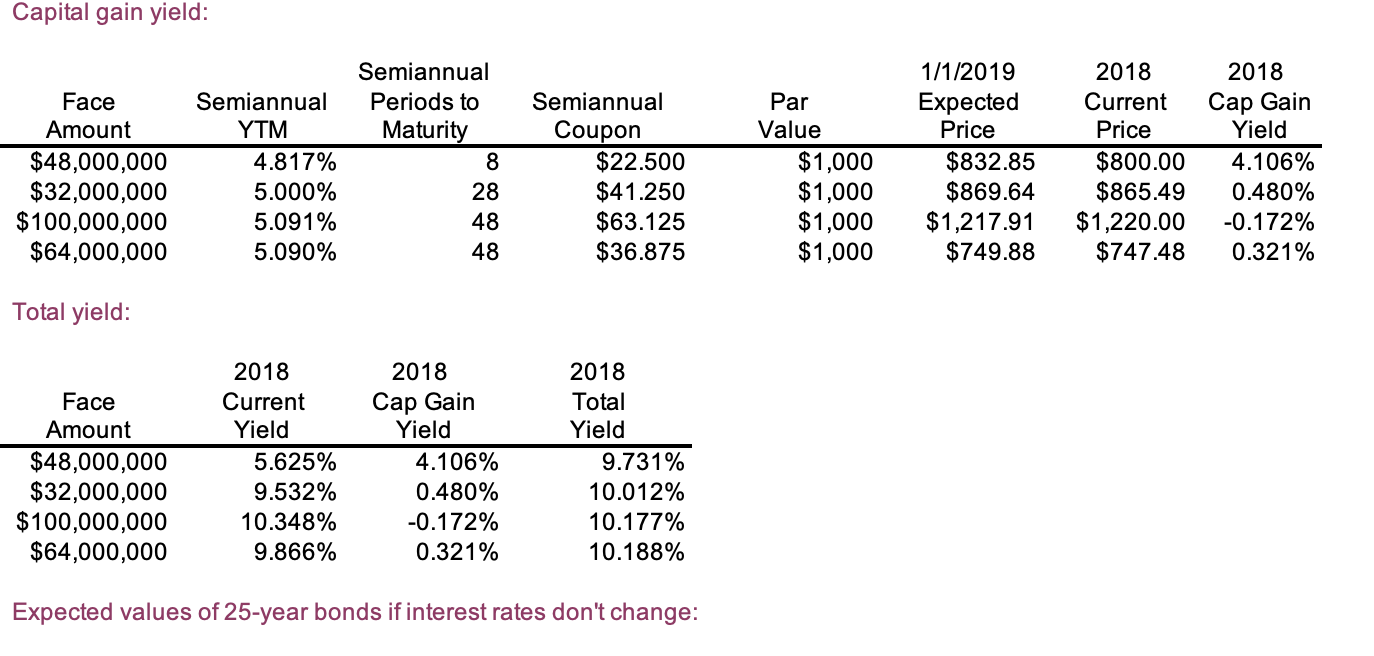
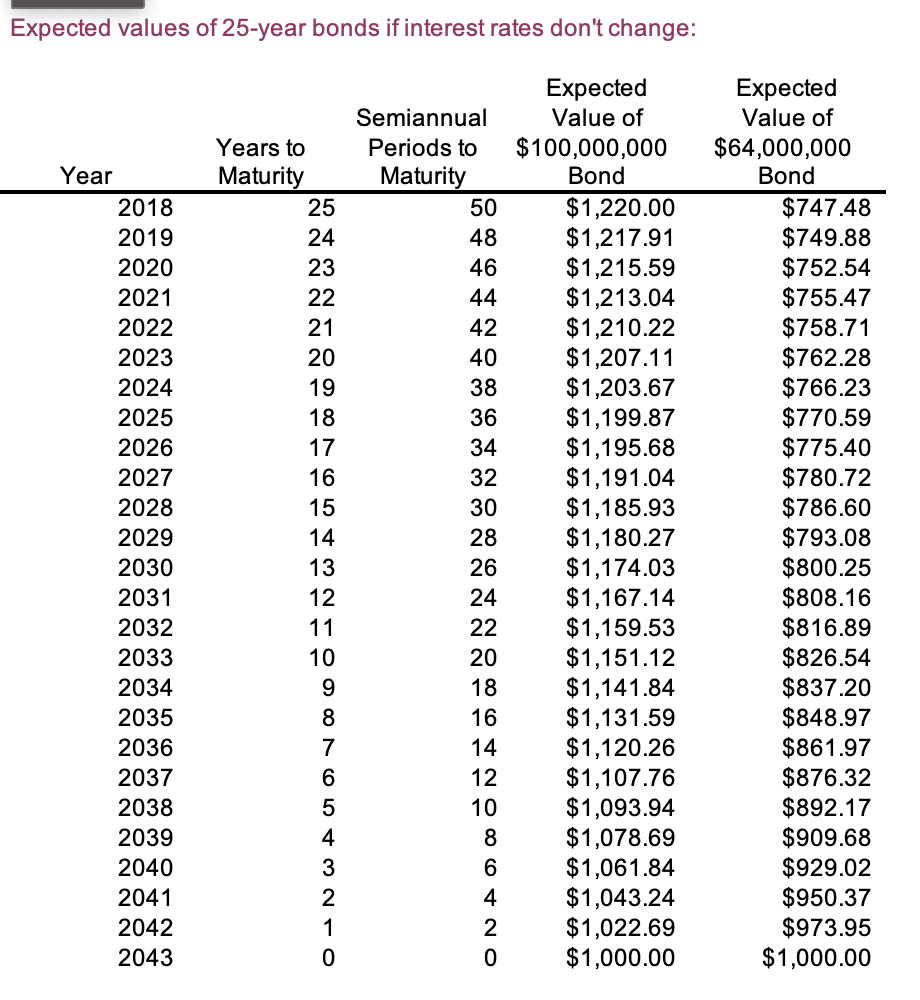
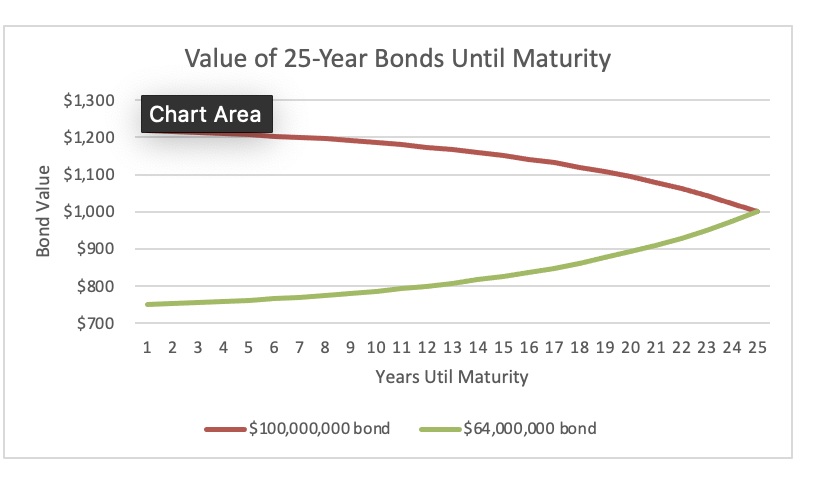 This discussion is on Pink Chapter 13. Use the excel spreadsheet associated with this chapter in your response. Your response should have 500+ words, else it will receive no credit. The submission should be a single document that includes screenshots of your excel formulas/calculations. 1. To prepare for the meeting, create a summary of the yields of each bond by completing the table shown in exhibit 13. 2. Remember that the YTM of each bond is assumed to be the required rate of return of each bond and that the semiannual YTM must be multiplied by two to get the stated (nominal) YTM.2. At the meeting, a committee member asks, The two 25-year bonds have the same maturity date, so why do the current yields and capital gain yields of these bonds differ? How do you reply to the committee member? (Hint: No additional calculations are required.) 3. Next, the committee member notices that there is an expected capital gain on one of the 25-year bonds and a capital loss on the other and so asks, assuming current interest rates dont change, will these gains and losses continue over the life of the bond? (Hint: In one figure, graph the expected value of each bond over the 25 years to maturity.)
CASE 13 PACIFIC HEALTHCARE (A): Bond Valuation 12/1/17 Par Years to Maturity Face Amount $48,000,000 $32,000,000 $100,000,000 $64,000,000 2018 Current Price $800.00 $865.49 $1,220.00 $747.48 Value $1,000 $1,000 $1,000 $1,000 Coupon Rate 4.50% 8.25% 12.625% 7.375% 5 15 25 25 Compounding periods per year Years to call Call premium 2 5 $50 Annual yield to maturity: Semiannual YTM Face Amount $48,000,000 $32,000,000 $100,000,000 $64,000,000 Semiannual Periods to Maturity 10 30 50 50 Semiannual Coupon $22.500 $41.250 $63.125 $36.875 Current Price ($800.00) ($865.49) ($1,220.00) ($747.48) Par Value $1,000 $1,000 $1,000 $1,000 4.817% 5.000% 5.091% 5.090% Annual YTM 9.634% 10.000% 10.181% 10.180% Current yield: Face Amount $48,000,000 $32,000,000 $100,000,000 $64,000,000 2018 Coupon Payments $45.00 $82.50 $126.25 $73.75 2018 Current Price $800.00 $865.49 $1,220.00 $747.48 2018 Current Yield 5.625% 9.532% 10.348% 9.866% Capital gain yield: Face Amount $48,000,000 $32,000,000 $100,000,000 $64,000,000 Semiannual YTM 4.817% 5.000% 5.091% 5.090% Semiannual Periods to Maturity 8 28 48 48 Semiannual Coupon $22.500 $41.250 $63.125 $36.875 Par Value $1,000 $1,000 $1,000 $1,000 1/1/2019 Expected Price $832.85 $869.64 $1,217.91 $749.88 2018 Current Price $800.00 $865.49 $1,220.00 $747.48 2018 Cap Gain Yield 4.106% 0.480% -0.172% 0.321% Total yield: Face Amount $48,000,000 $32,000,000 $100,000,000 $64,000,000 2018 Current Yield 5.625% 9.532% 10.348% 9.866% 2018 Cap Gain Yield 4.106% 0.480% -0.172% 0.321% 2018 Total Yield 9.731% 10.012% 10.177% 10.188% Expected values of 25-year bonds if interest rates don't change: Expected values of 25-year bonds if interest rates don't change: Year 2018 2019 2020 2021 2022 2023 2024 2025 2026 2027 2028 2029 2030 2031 2032 2033 2034 2035 2036 2037 2038 2039 2040 2041 2042 2043 Years to Maturity 25 24 23 22 21 20 19 18 17 16 15 14 13 12 11 10 9 8 7 6 5 4 3 2 1 Semiannual Periods to Maturity 50 48 46 44 42 40 38 36 34 32 30 28 26 24 22 20 18 16 14 12 10 8 6 4 2 0 Expected Value of $100,000,000 Bond $1,220.00 $1,217.91 $1,215.59 $1,213.04 $1,210.22 $1,207.11 $1,203.67 $1,199.87 $1,195.68 $1,191.04 $1,185.93 $1,180.27 $1,174.03 $1,167.14 $1,159.53 $1,151.12 $1,141.84 $1,131.59 $1,120.26 $1,107.76 $1,093.94 $1,078.69 $1,061.84 $1,043.24 $1,022.69 $1,000.00 Expected Value of $64,000,000 Bond $747.48 $749.88 $752.54 $755.47 $758.71 $762.28 $766.23 $770.59 $775.40 $780.72 $786.60 $793.08 $800.25 $808.16 $816.89 $826.54 $837.20 $848.97 $861.97 $876.32 $892.17 $909.68 $929.02 $950.37 $973.95 $1,000.00 Value of 25-Year Bonds Until Maturity $1,300 $1,200 Chart Area $1,100 Bond Value $1,000 $900 $800 $700 1 2 3 4 5 6 7 8 9 10 11 12 13 14 15 16 17 18 19 20 21 22 23 24 25 Years Util Maturity - $100,000,000 bond -$ 64,000,000 bond CASE 13 PACIFIC HEALTHCARE (A): Bond Valuation 12/1/17 Par Years to Maturity Face Amount $48,000,000 $32,000,000 $100,000,000 $64,000,000 2018 Current Price $800.00 $865.49 $1,220.00 $747.48 Value $1,000 $1,000 $1,000 $1,000 Coupon Rate 4.50% 8.25% 12.625% 7.375% 5 15 25 25 Compounding periods per year Years to call Call premium 2 5 $50 Annual yield to maturity: Semiannual YTM Face Amount $48,000,000 $32,000,000 $100,000,000 $64,000,000 Semiannual Periods to Maturity 10 30 50 50 Semiannual Coupon $22.500 $41.250 $63.125 $36.875 Current Price ($800.00) ($865.49) ($1,220.00) ($747.48) Par Value $1,000 $1,000 $1,000 $1,000 4.817% 5.000% 5.091% 5.090% Annual YTM 9.634% 10.000% 10.181% 10.180% Current yield: Face Amount $48,000,000 $32,000,000 $100,000,000 $64,000,000 2018 Coupon Payments $45.00 $82.50 $126.25 $73.75 2018 Current Price $800.00 $865.49 $1,220.00 $747.48 2018 Current Yield 5.625% 9.532% 10.348% 9.866% Capital gain yield: Face Amount $48,000,000 $32,000,000 $100,000,000 $64,000,000 Semiannual YTM 4.817% 5.000% 5.091% 5.090% Semiannual Periods to Maturity 8 28 48 48 Semiannual Coupon $22.500 $41.250 $63.125 $36.875 Par Value $1,000 $1,000 $1,000 $1,000 1/1/2019 Expected Price $832.85 $869.64 $1,217.91 $749.88 2018 Current Price $800.00 $865.49 $1,220.00 $747.48 2018 Cap Gain Yield 4.106% 0.480% -0.172% 0.321% Total yield: Face Amount $48,000,000 $32,000,000 $100,000,000 $64,000,000 2018 Current Yield 5.625% 9.532% 10.348% 9.866% 2018 Cap Gain Yield 4.106% 0.480% -0.172% 0.321% 2018 Total Yield 9.731% 10.012% 10.177% 10.188% Expected values of 25-year bonds if interest rates don't change: Expected values of 25-year bonds if interest rates don't change: Year 2018 2019 2020 2021 2022 2023 2024 2025 2026 2027 2028 2029 2030 2031 2032 2033 2034 2035 2036 2037 2038 2039 2040 2041 2042 2043 Years to Maturity 25 24 23 22 21 20 19 18 17 16 15 14 13 12 11 10 9 8 7 6 5 4 3 2 1 Semiannual Periods to Maturity 50 48 46 44 42 40 38 36 34 32 30 28 26 24 22 20 18 16 14 12 10 8 6 4 2 0 Expected Value of $100,000,000 Bond $1,220.00 $1,217.91 $1,215.59 $1,213.04 $1,210.22 $1,207.11 $1,203.67 $1,199.87 $1,195.68 $1,191.04 $1,185.93 $1,180.27 $1,174.03 $1,167.14 $1,159.53 $1,151.12 $1,141.84 $1,131.59 $1,120.26 $1,107.76 $1,093.94 $1,078.69 $1,061.84 $1,043.24 $1,022.69 $1,000.00 Expected Value of $64,000,000 Bond $747.48 $749.88 $752.54 $755.47 $758.71 $762.28 $766.23 $770.59 $775.40 $780.72 $786.60 $793.08 $800.25 $808.16 $816.89 $826.54 $837.20 $848.97 $861.97 $876.32 $892.17 $909.68 $929.02 $950.37 $973.95 $1,000.00 Value of 25-Year Bonds Until Maturity $1,300 $1,200 Chart Area $1,100 Bond Value $1,000 $900 $800 $700 1 2 3 4 5 6 7 8 9 10 11 12 13 14 15 16 17 18 19 20 21 22 23 24 25 Years Util Maturity - $100,000,000 bond -$ 64,000,000 bond
Step by Step Solution
There are 3 Steps involved in it

Get step-by-step solutions from verified subject matter experts