

Question: Explain in some detail how the Precision Tree calculations in Figure 6.11 for the Acme problem are exactly the same as those for the
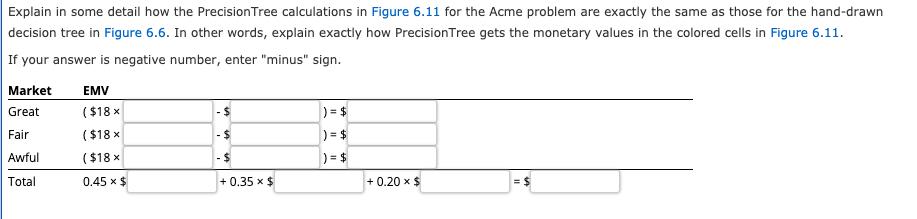
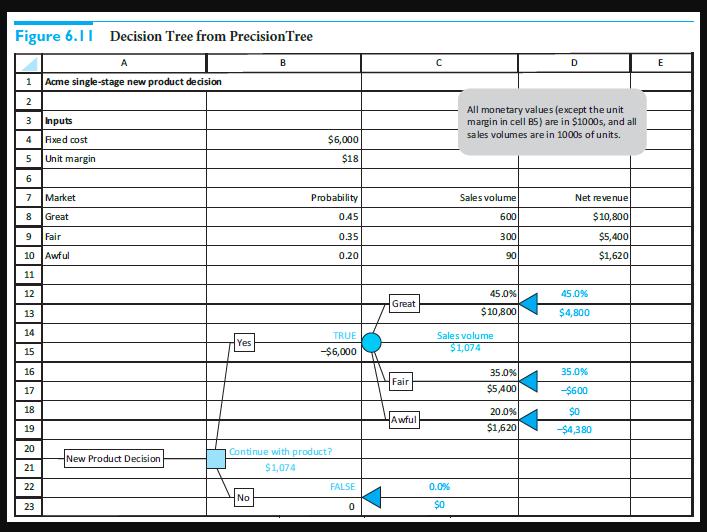
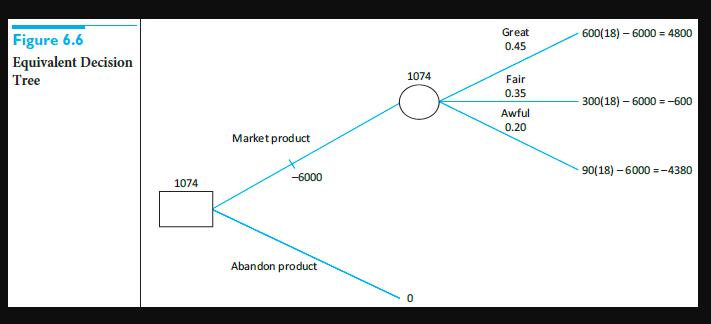
Explain in some detail how the Precision Tree calculations in Figure 6.11 for the Acme problem are exactly the same as those for the hand-drawn decision tree in Figure 6.6. In other words, explain exactly how Precision Tree gets the monetary values in the colored cells in Figure 6.11. If your answer is negative number, enter "minus" sign. Market Great Fair Awful Total EMV ($18 x ($18 x ($18 x 0.45 x $ +0.35 x $ ) = $ ) = $ ) = $ + 0.20 $ Figure 6.11 Decision Tree from Precision Tree 1 Acme single-stage new product decision 2 3 4 Inputs Fixed cost Unit margin 5 6 7 8 Great Market A 9 Fair 10 Awful 11 12 13 14 15 16 17 18 19 20 21 22 23 New Product Decision Yes B No $6,000 $18 Probability 0.45 0.35 0.20 TRUE -$6,000 Continue with product? $1,074 FALSE 0 Great Fair Awful C 0.0% $0 All monetary values (except the unit margin in cell BS) are in $1000s, and all sales volumes are in 1000s of units. Sales volume 600 300 90 45.0% $10,800 Sales volume $1,074 35.0% $5,400 D 20.0% $1,620 Net revenue $10,800 $5,400 $1,620 45.0% $4,800 35.0% -$600 $0 -$4,380 E Figure 6.6 Equivalent Decision Tree 1074 Market product -6000 Abandon product 1074 O Great 0.45 Fair 0.35 Awful 0.20 600(18)-6000 4800 300(18)-6000-600 90(18)-6000-4380
Step by Step Solution
3.35 Rating (142 Votes )
There are 3 Steps involved in it

Get step-by-step solutions from verified subject matter experts