

Question: EXPLAIN SHOW ALL WORK AND ANSWER THOUGHROUGHLY The data in the table represents the average number of daylight hours each month in Springfield in 2015,
EXPLAIN SHOW ALL WORK AND ANSWER THOUGHROUGHLY
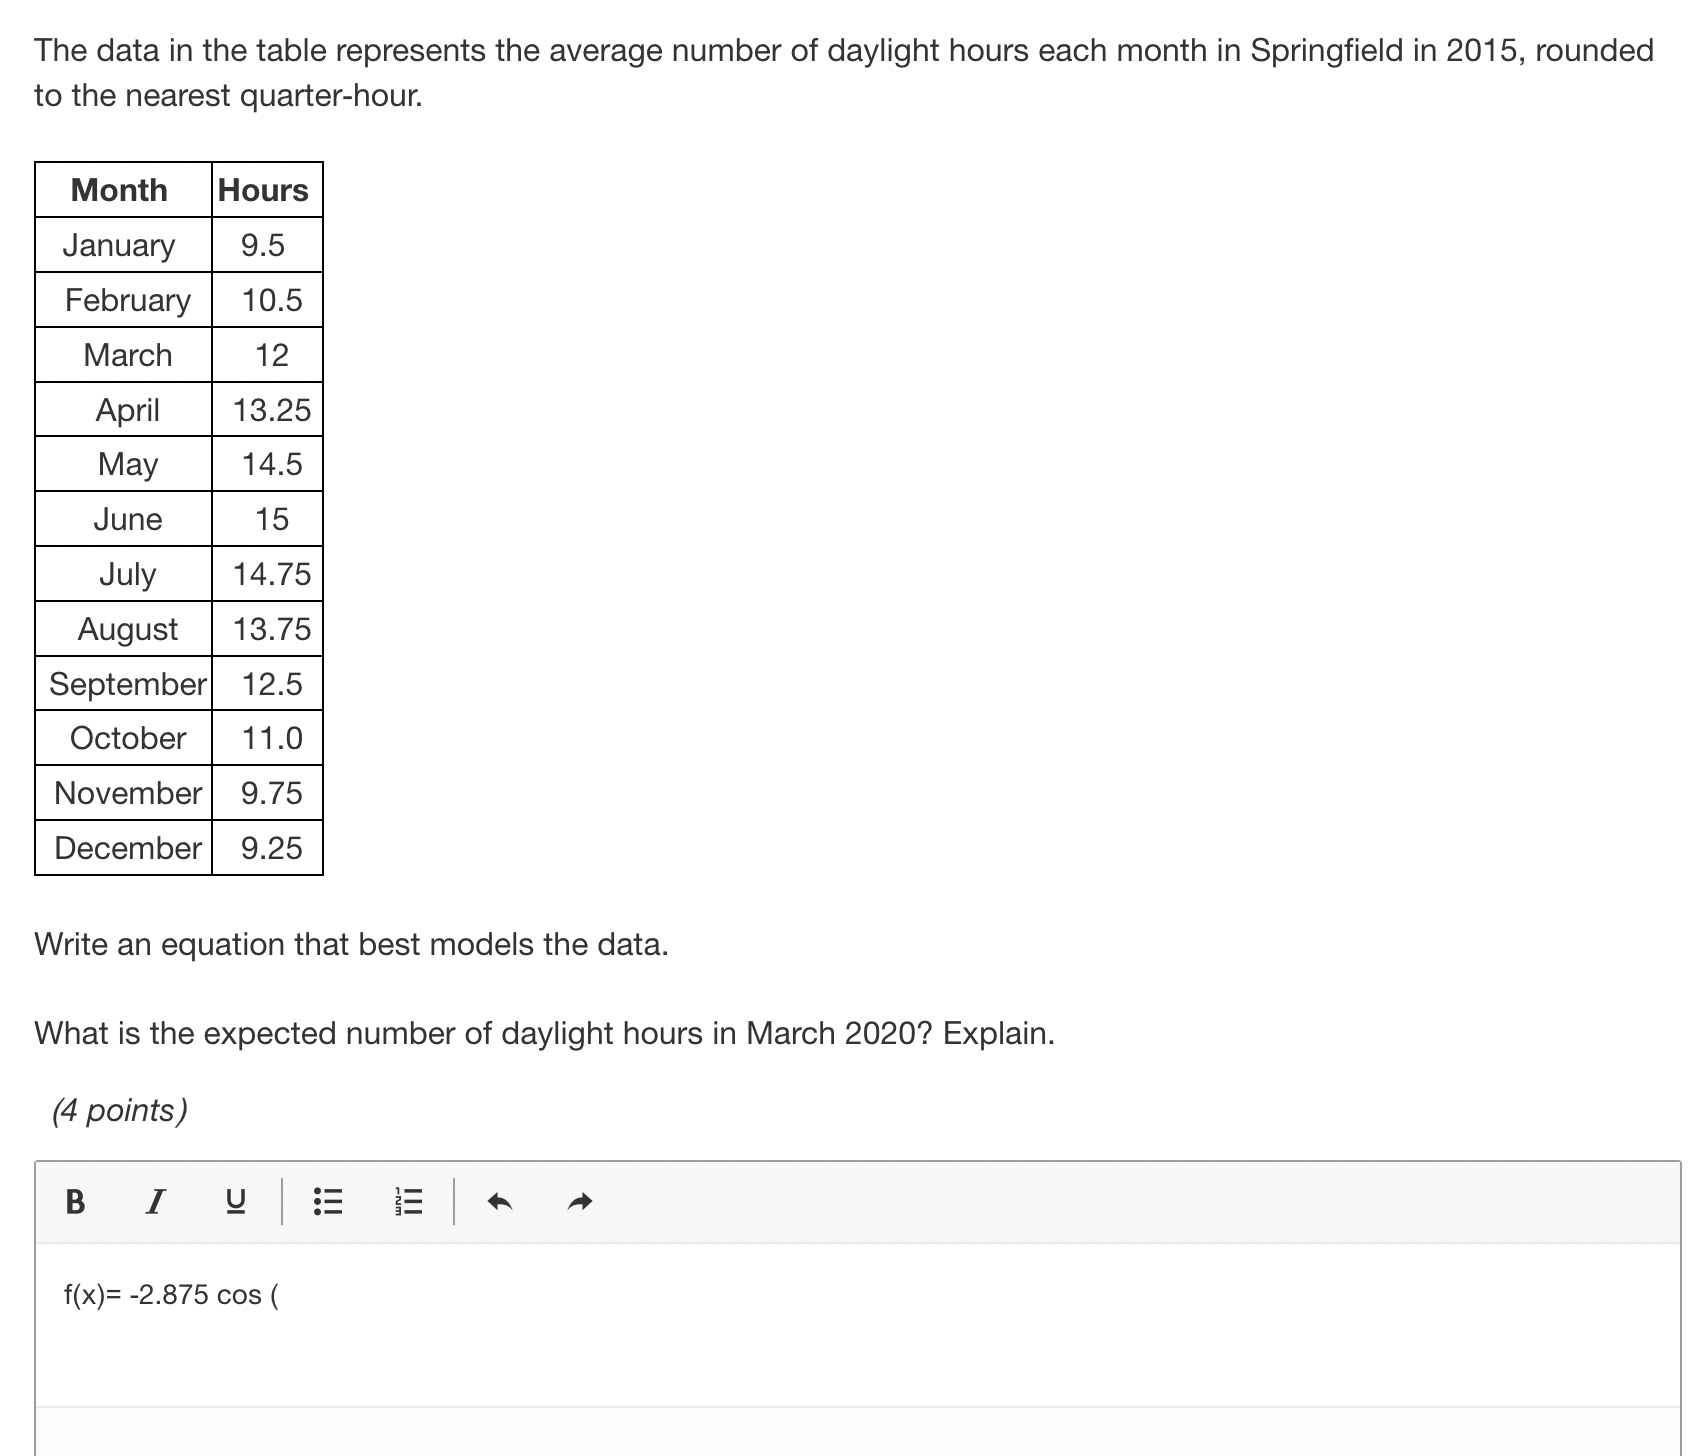
The data in the table represents the average number of daylight hours each month in Springfield in 2015, rounded to the nearest quarter-hour. Month Hours January 9.5 February 10.5 March 12 April 13.25 May 14.5 June 15 July 14.75 August 13.75 September 12.5 October 11.0 November 9.75 December 9.25 Write an equation that best models the data. What is the expected number of daylight hours in March 2020? Explain. (4 points) B f(x)= -2.875 cos (Explain why domain restrictions are necessary to create inverse trigonometric functions rather than relations. (4 points) 0Word(s)
Step by Step Solution
There are 3 Steps involved in it
1 Expert Approved Answer
Step: 1 Unlock

Question Has Been Solved by an Expert!
Get step-by-step solutions from verified subject matter experts
Step: 2 Unlock
Step: 3 Unlock