

Question: explain the below Computing a Characteristic Line: An Example The example shows how to estimate a characteristic line for Microsoft Corp (MSFT) using monthly return
explain the below
Computing a Characteristic Line: An Example The example shows how to estimate a characteristic line for Microsoft Corp (MSFT) using monthly return data from January 2016 to December 2016 Betas for MSFT are calculated using: The S&P 500 (SPX) The MSCI World Equity (MXWO) index
see Exhibits 7.5, 7.6, 7.7
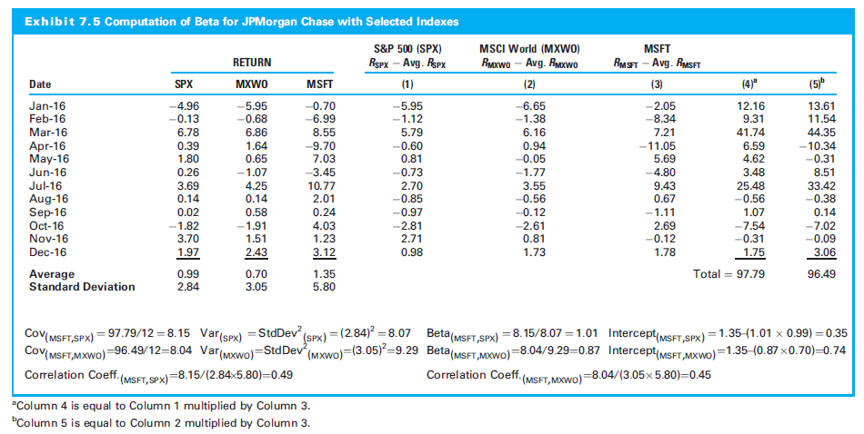
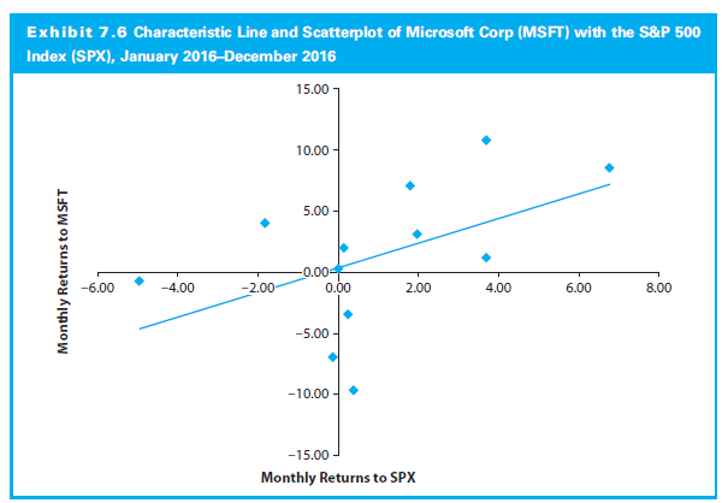
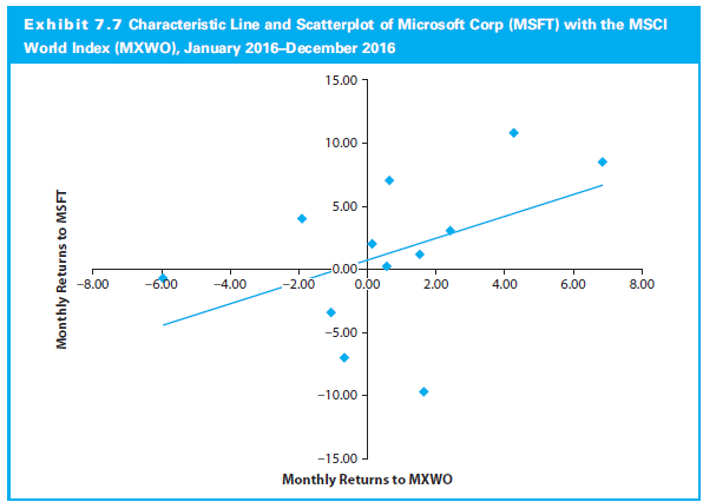
a Column 4 is equal to Column 1 multiplied by Column 3 . b Column 5 is equal to Column 2 multiplied by Column 3 . Exhibit 7.6 Characteristic Line and Scatterplot of Microsoft Corp (MSFT) with the S\&P 500 Index (SPX), January 2016-December 2016 Exhibit 7.7 Characteristic Line and Scatterplot of Microsoft Corp (MSFT) with the MSCI a Column 4 is equal to Column 1 multiplied by Column 3 . b Column 5 is equal to Column 2 multiplied by Column 3 . Exhibit 7.6 Characteristic Line and Scatterplot of Microsoft Corp (MSFT) with the S\&P 500 Index (SPX), January 2016-December 2016 Exhibit 7.7 Characteristic Line and Scatterplot of Microsoft Corp (MSFT) with the MSCI
Step by Step Solution
There are 3 Steps involved in it

Get step-by-step solutions from verified subject matter experts