

Question: Explain the data and probability distribution for the data in the p-chart. As an illustration, consider the data given in Table 2A. In the dataset,
Explain the data and probability distribution for the data in the p-chart. 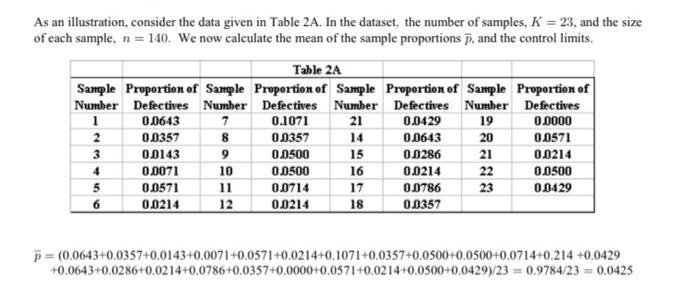
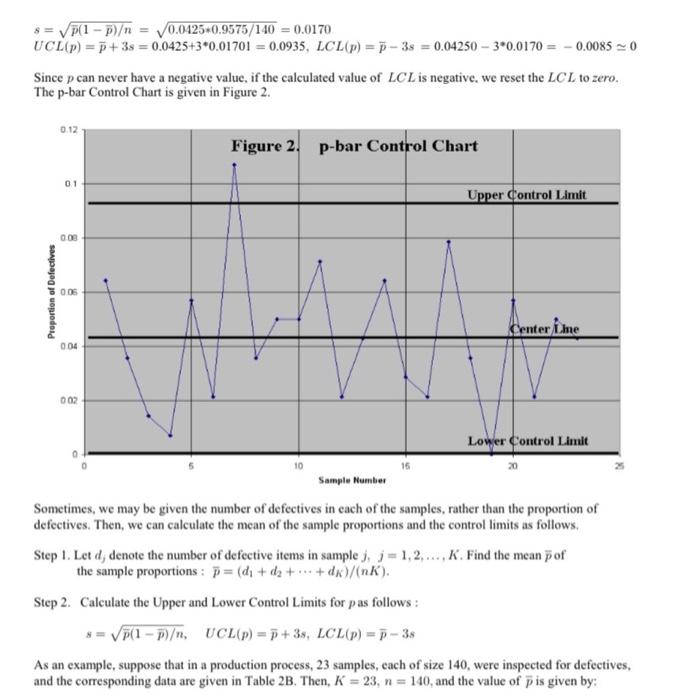
As an illustration, consider the data given in Table 2A. In the dataset, the number of samples, K=23, and the size of each sample, n=140. We now calculate the mean of the sample proportions p, and the control limits. p=(0.0643+0.0357+0.0143+0.0071+0.0571+0.0214+0.1071+0.0357+0.0500+0.0500+0.0714+0.214+0.0429+0.0643+0.0286+0.0214+0.0786+0.0357+0.0000+0.0571+0.0214+0.0500+0.0429)/23=0.9784/23=0.0425 s=p(1p)=0.04250.9575/140=0.0170 UCL(p)=p+3s=0.0425+30.01701=0.0935,LCL(p)=p3s=0.0425030.0170=0.00850 Since p can never have a negative value, if the calculated value of LCL is negative. we reset the LCL to zero. The p-bar Control Chart is given in Figure 2. Sometimes, we may be given the number of defectives in each of the samples, rather than the proportion of defectives. Then, we can calculate the mean of the sample proportions and the control limits as follows. Step 1. Let dj denote the number of defective items in sample j,j=1,2,,K. Find the mean p of the sample proportions : p=(d1+d2++dK)/(nK). Step 2. Calculate the Upper and Lower Control Limits for p as follows : s=p(1p),UCL(p)=p+3s,LCL(p)=p3s As an example, suppose that in a production process, 23 samples, each of size 140, were inspected for defectives, and the corresponding data are given in Table 2B. Then, K=23,n=140, and the value of p is given by Step by Step Solution
There are 3 Steps involved in it
1 Expert Approved Answer
Step: 1 Unlock

Question Has Been Solved by an Expert!
Get step-by-step solutions from verified subject matter experts
Step: 2 Unlock
Step: 3 Unlock