

Question: Explain the data and probability distribution for the data in the c-chart. For the data in Table 3, we have K=28. c=(8+11+5+7+8+6+4+17+3+9+6+11+7+10+8+4+3+9+7+5+10+7+6+5+5+4+8+7)/28=200/28=7.14 s=c=7.143=2.673 UCL(c)=c+3s=7.143+32.673=15.162,LCL(c)=c3s=7.14332.673=0.8760.0 Since
Explain the data and probability distribution for the data in the c-chart. 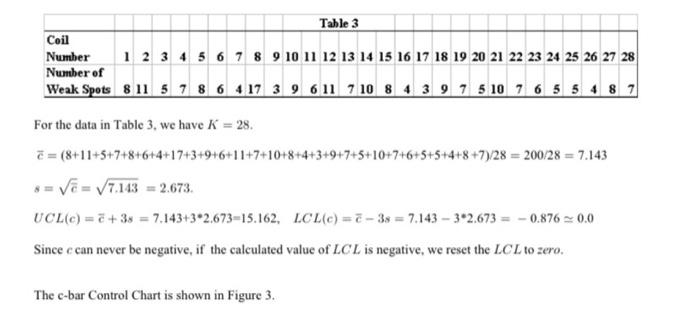
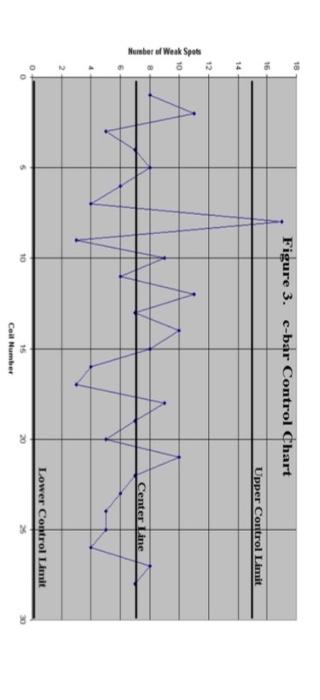
For the data in Table 3, we have K=28. c=(8+11+5+7+8+6+4+17+3+9+6+11+7+10+8+4+3+9+7+5+10+7+6+5+5+4+8+7)/28=200/28=7.14 s=c=7.143=2.673 UCL(c)=c+3s=7.143+32.673=15.162,LCL(c)=c3s=7.14332.673=0.8760.0 Since c can never be negative, if the calculated value of LCL is negative, we reset the LCL to zero. The c-bar Control Chart is shown in Figure 3
Step by Step Solution
There are 3 Steps involved in it
1 Expert Approved Answer
Step: 1 Unlock

Question Has Been Solved by an Expert!
Get step-by-step solutions from verified subject matter experts
Step: 2 Unlock
Step: 3 Unlock