

Question: Explain the graph below in details please Figure 3-0.2-ASTM, True Boiling Point, and Equilibrium Flash Vaporization Distillation Curves for a Naphtha-Kerosine Blend
Explain the graph below in details please 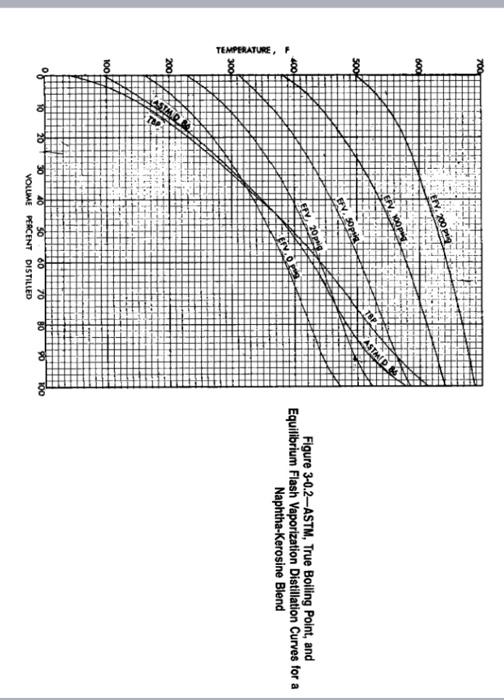
Figure 3-0.2-ASTM, True Boiling Point, and Equilibrium Flash Vaporization Distillation Curves for a Naphtha-Kerosine Blend
Step by Step Solution
There are 3 Steps involved in it
1 Expert Approved Answer
Step: 1 Unlock

Question Has Been Solved by an Expert!
Get step-by-step solutions from verified subject matter experts
Step: 2 Unlock
Step: 3 Unlock