

Question: Explain the steps please? Answer this question according to lecture discussion. Assume the diagram provided below represents the marginal cost (MC), the average variable cost
Explain the steps please?
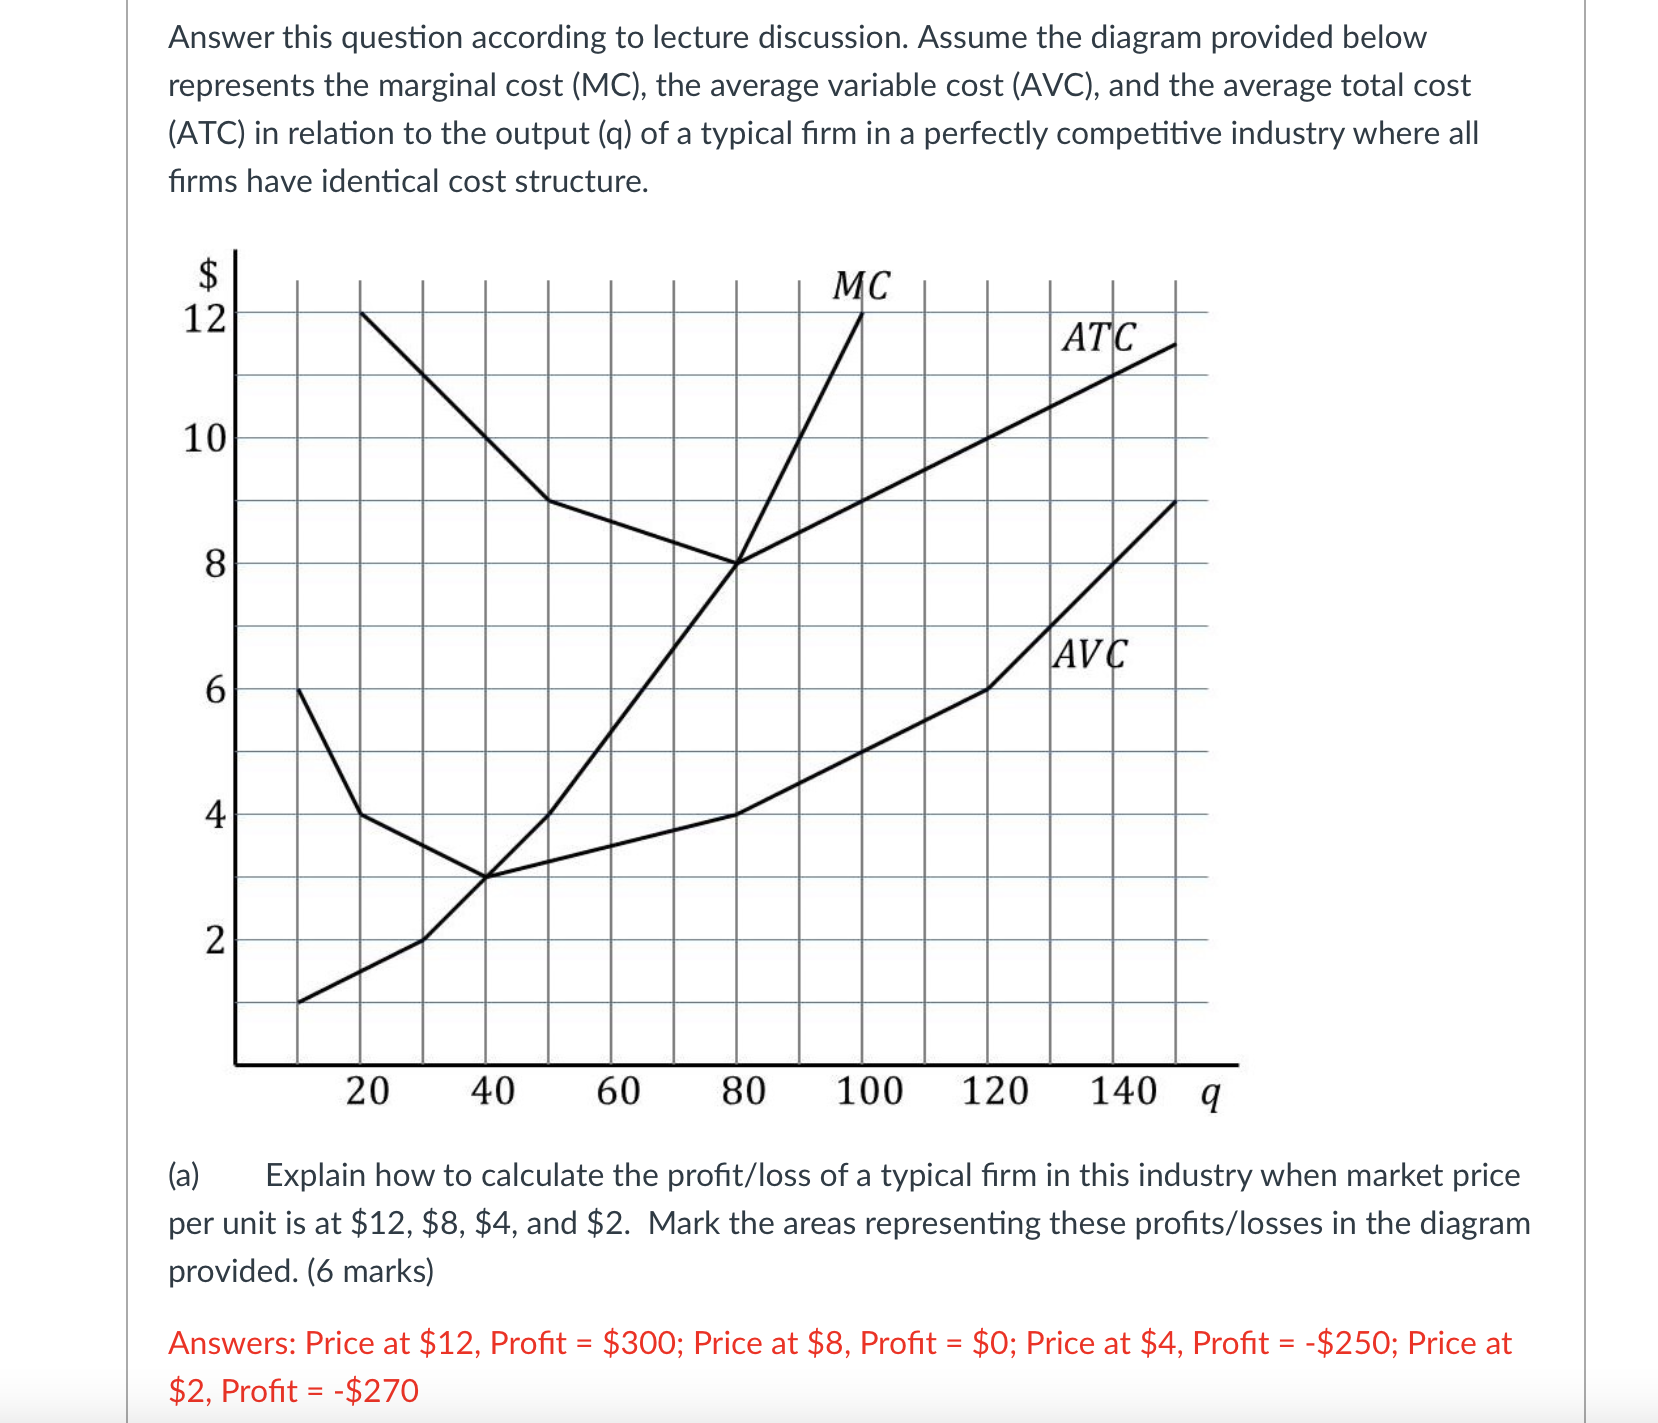
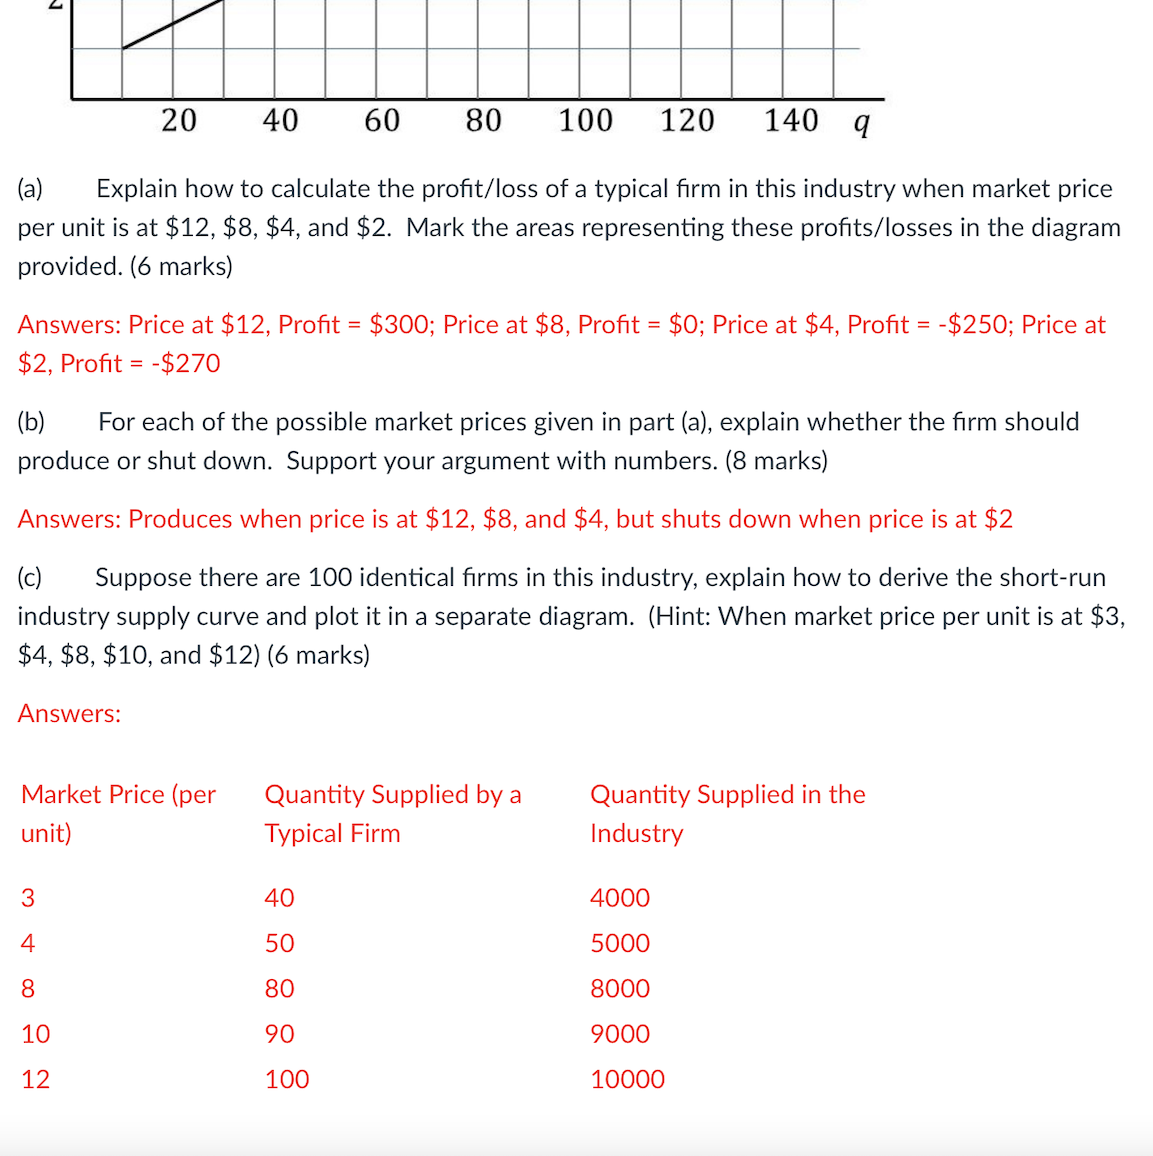
Answer this question according to lecture discussion. Assume the diagram provided below represents the marginal cost (MC), the average variable cost (AVC), and the average total cost (ATC) in relation to the output (q) of a typical firm in a perfectly competitive industry where all firms have identical cost structure. 12 MC ATC 10 8 AVC 6 4 2 20 40 60 80 100 120 140 q (a) Explain how to calculate the profit/loss of a typical firm in this industry when market price per unit is at $12, $8, $4, and $2. Mark the areas representing these profits/losses in the diagram provided. (6 marks) Answers: Price at $12, Profit = $300; Price at $8, Profit = $0; Price at $4, Profit = -$250; Price at $2, Profit = -$27020 40 60 80 100 120 140 q (3) Explain how to calculate the prot/ loss of a typical rm in this industry when market price per unit is at $12, $8, $4, and $2. Mark the areas representing these prots/losses in the diagram provided. (6 marks) Answers: Price at $12, Prot = $300; Price at $8, Prot = $0; Price at $4, Prot = -$250; Price at $2, Prot = -$270 (b) For each of the possible market prices given in part (a), explain whether the rm should produce or shut down. Support your argument with numbers. (8 marks) Answers: Produces when price is at $12, $8, and $4, but shuts down when price is at $2 (c) Suppose there are 100 identical rms in this industry, explain how to derive the short-run industry supply curve and plot it in a separate diagram. (Hint: When market price per unit is at $3, $4, $8, $10, and $12) (6 marks) Answers: Market Price (per Quantity Supplied by 3 Quantity Supplied in the unit) Typical Firm Industry 3 40 4000 4 50 5000 8 80 8000 10 90 9000 12 100 10000
Step by Step Solution
There are 3 Steps involved in it

Get step-by-step solutions from verified subject matter experts