

Question: Explain this chart. 6. Explain the chart below: Year 2 0 3 40 Cash flows ($13,000,000,000) $1,000,000,000 $1,600,000,000 $2,250,000,000 $2.250,000,000 Figure 8.1 Annual cash-flow estimates
Explain this chart. 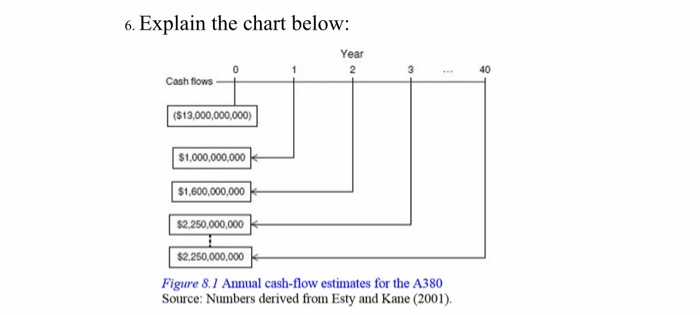
6. Explain the chart below: Year 2 0 3 40 Cash flows ($13,000,000,000) $1,000,000,000 $1,600,000,000 $2,250,000,000 $2.250,000,000 Figure 8.1 Annual cash-flow estimates for the A380 Source: Numbers derived from Esty and Kane (2001)
Step by Step Solution
There are 3 Steps involved in it
1 Expert Approved Answer
Step: 1 Unlock

Question Has Been Solved by an Expert!
Get step-by-step solutions from verified subject matter experts
Step: 2 Unlock
Step: 3 Unlock