

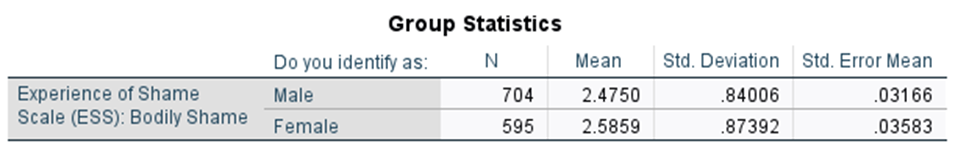
Question: explain this chart Group Statistics Do you identify as: N Mean Std. Deviation Std. Error Mean Experience of Shame Male 704 2.4750 .84006 03166 Scale
explain this chart
Step by Step Solution
There are 3 Steps involved in it
1 Expert Approved Answer
Step: 1 Unlock

Question Has Been Solved by an Expert!
Get step-by-step solutions from verified subject matter experts
Step: 2 Unlock
Step: 3 Unlock