

Question: explain this flowchart step by step Marked image Scan image and Data extraction Extracted payload Shift histogram back Extracted overhead Recover value of minimum point
explain this flowchart step by step
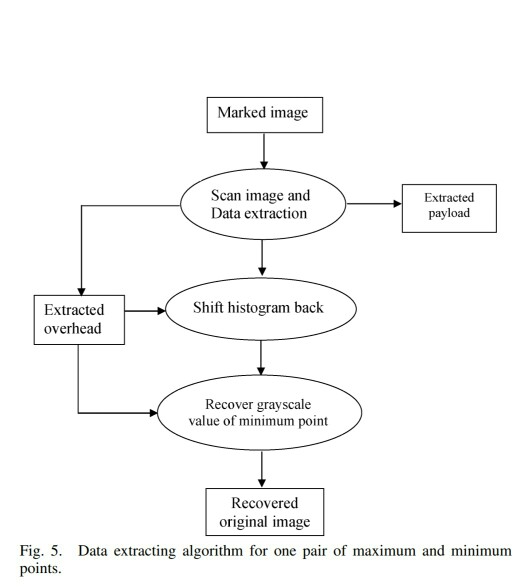
Marked image Scan image and Data extraction Extracted payload Shift histogram back Extracted overhead Recover value of minimum point grayscale Recovered original image Fig. 5. Data extracting algorithm for one pair of maximum and minimum points
Step by Step Solution
There are 3 Steps involved in it
1 Expert Approved Answer
Step: 1 Unlock

Question Has Been Solved by an Expert!
Get step-by-step solutions from verified subject matter experts
Step: 2 Unlock
Step: 3 Unlock