

Question: Explain this interaction plot. Interaction Plot for Molecular Weight Fitted Means 2975 -0562 2925 Mean of Molecular Weight 2900 2875 0582
Explain this interaction plot.
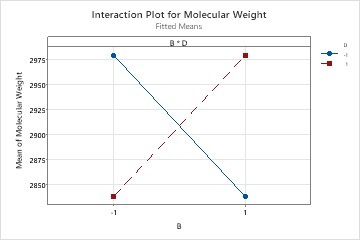
Interaction Plot for Molecular Weight Fitted Means 2975 -0562 2925 Mean of Molecular Weight 2900 2875 0582
Step by Step Solution
There are 3 Steps involved in it
1 Expert Approved Answer
Step: 1 Unlock

Question Has Been Solved by an Expert!
Get step-by-step solutions from verified subject matter experts
Step: 2 Unlock
Step: 3 Unlock