

Question: Thanks for your help NEED TO SOLVE STEP WISE Two factors in a manufacturing prooess for an integrated circuit are studied in a twofactor experiment.
Thanks for your help
NEED TO SOLVE STEP WISE
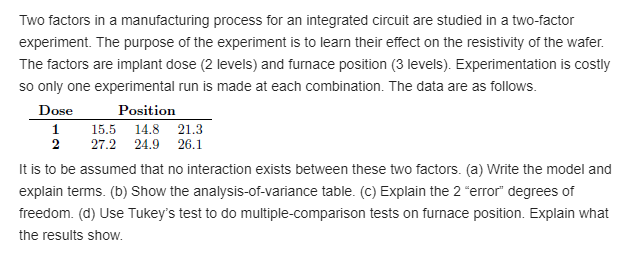
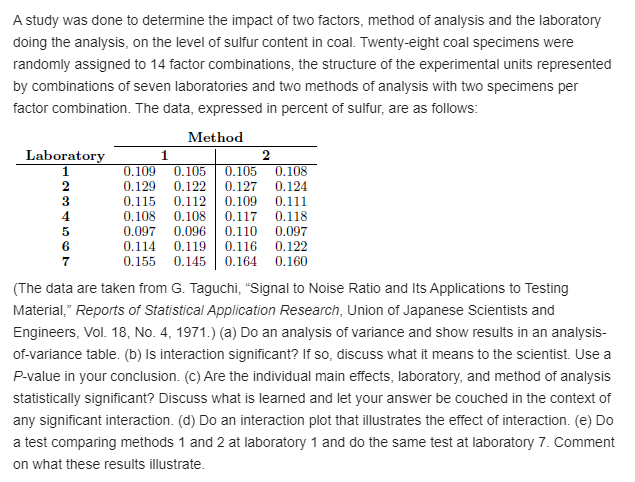
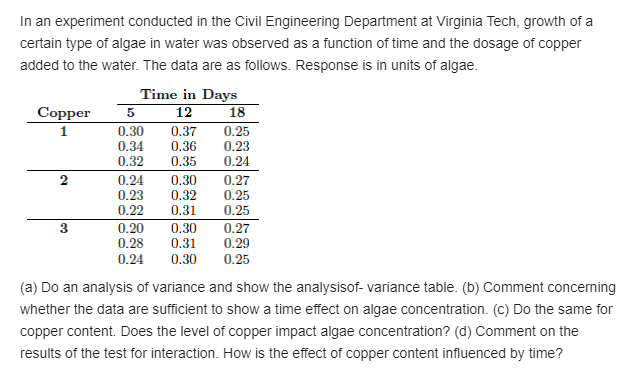
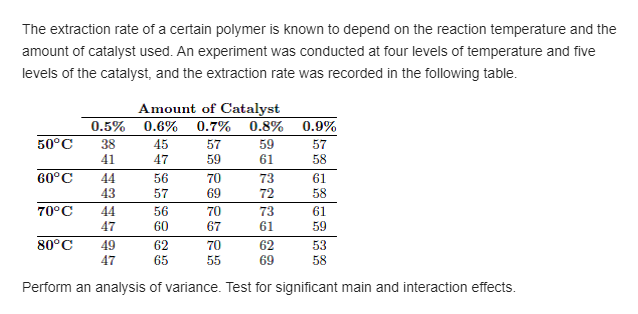
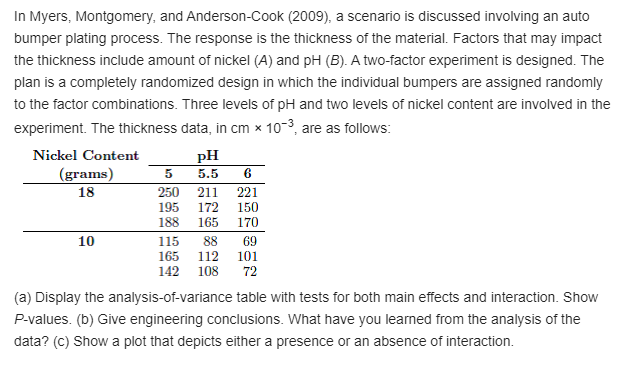
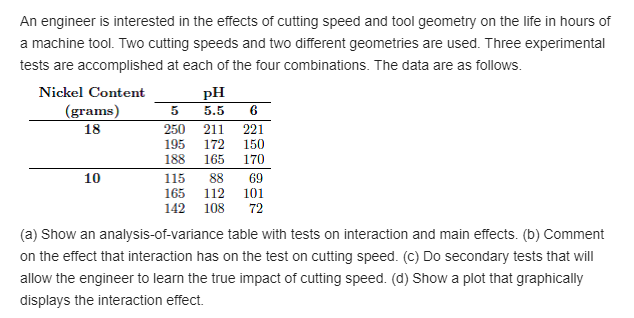
Two factors in a manufacturing prooess for an integrated circuit are studied in a twofactor experiment. The purpose of the experiment is to learn their effect on the resistivity of the wafer. The factors are implant dose [2 levels} and furnace position {3 levels}. Experimentation is costly.r so onlyr one experimental run is made at each combination. The data are as follows. Dose Position 1 15.5 14.8 21.3 2 2?.2 24.9 25.1 It is to be assumed that no interaction exists between these two factors. {a} Write the model and explain terms. {h} Show the analysisofvarianoe table. {c} Explain the 2 \"erroI' degrees of freedom. {d} Use Tukey's test to do multiplecompanson tests on furnace position. Explain what the results show. A study was done to determine the impact of two factors, method of analysis and the laboratory doing the analysis, on the level of sulfur content in ooal. Twentyeight ooal specimens were randomly assigned to 14 factor combinations, the sthcture of the expemental units represented by combinations of seyen laboratories and two methods of analysis with two specimens per factor combination. The data, expressed in percent of sulfur, are as follows: Method [lathcurator}T 1 2 [11119 0.105 I]. 1'15 [1.1113 [1129 0.122 I]. 1'2? [1.1514 [1.115 11112 11109 [1.111 [11113 0.103- llll? [1.113 [11197 0.095 I]. Ill] [1119? [1114 0.119 [1.116 [1.122 [1.155 0.145 I]. 164 11.151] Hamil-moans- {The data are taken from G. Tag uchi, \"Signal to Noise Ratio and Its Applications to Testing Material,\" Reports of Statistical Application Research, Union of Japanese Scientists and Engineers, Vol. 18, No. 4, 19?1.} {a} Do an analysis of variance and show results in an analysis ofyariance table. {b} Is interaction signicant? It so, discuss what it means to the scientist. Use a Pyalue in your conclusion. {c} are the indiyidual main effects, laboratory, and method of analysis staljsljcally signicant? Discuss what is learned and let your answer be couched in the context of any signicant interaction. {d} Do an interaction plot that illustrates the effect of interaction. {e} Do a test companng methods 1 and 2 at laboratory 1 and do the same test at laboratory T. Comment on what these results illustrate. In an expen'ment conducted in the Civil Engineen'ng Department at 'virginia Tech, growth of a oertain type of algae in water was observed as a function of time and the dosage of copper added to the water. The data are as follows. Response is in units of algae. Time in Days Copper 5 12 13 1 0 30 0 37 0.25 (1234 p.35 p.23 p.32 p.35 p.24 2 0.24 0. 30 0.2? 0.23 0. 32 0.25 0.22 0. 31 0.25 3 0.20 0. 30 0.2? 0.23 0. 31 0.29 {1.24 oso 0.25 {a} Do an analysis of variance and show the analvsisof variance table. {is} Comment concerning whether the data are sufcient to show a time effect on algae ooncentration. {c} [lo the same for oopper oontent. Does the level of copper impact algae conoenlration? {d} Comment on the results of the test for interaction. How is the effect of copper content influenced by lime? \fIn Myers, Montgomery, and AndersonJCook {EGGS}, a scenario is discussed involving an auto bumper plating prooess. The response is the thickness of the material. Factors that may impact the thickness include amount of nickel {A} and pH [5). A twofactor expenment is designed. The plan is a completely randomized design in which the individual bumpers are assigned randomly to the factor combinations. Three levels of pH and two levels of nickel content are involved in the experiment. The thickness data, in cm x 1D'3, are as follows: Nickel Content pH {grams} 5 5.5 1 B 251.1 2 1 1 1515 1'72 133 135 1 U 115 33 155 112 142 HIE E 221 15E] l'] 69 101 T2 {a} Display the analysis~ofvariance table with tests for both main effects and interaction. Show P-values. [bl Give engineering conclusions. 1What have you leamed from the analysis ofthe data? {c} Show a plot that depicts either a presence or an absenoe of interaction. An engineer is interested in the elfecls of cutting speed and tool geometry.r on the life in hours of a machine tool. Two cutting speeds and two different geometries are used. Three experimental tests are accomplished at each of the four combinations. The data are as follows. Nickel Content pH [grams] 5 5. 5- G 1 E 250 2 1 1 221 195 1'i'2 150 133 165 l'] ID 115 38 69 165 112 101 142 1118 f2 {3) Show an analysisofuanance table with tests on interacljon and main effects. {o} Comment on the effect that interaction has on the test on cutting speed. {c} [lo secondary.r tests that will :3th the engineer to leam the true impact of cutting speed. [de Show a plot that graphically.r displays the interaction effect
Step by Step Solution
There are 3 Steps involved in it

Get step-by-step solutions from verified subject matter experts