

Question: a. Show the yield curve for the Treasury securities. b. Explain this yield curve using the unbiased expectations theory and the liquidity preference theory.
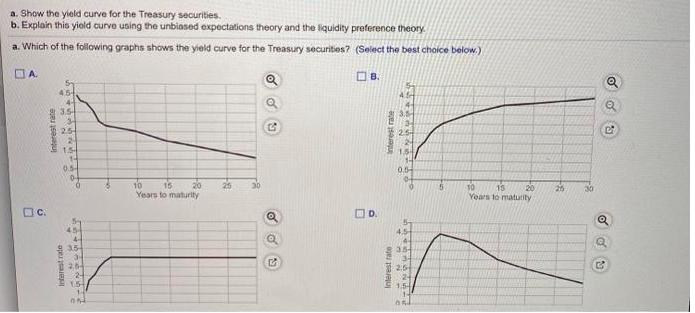
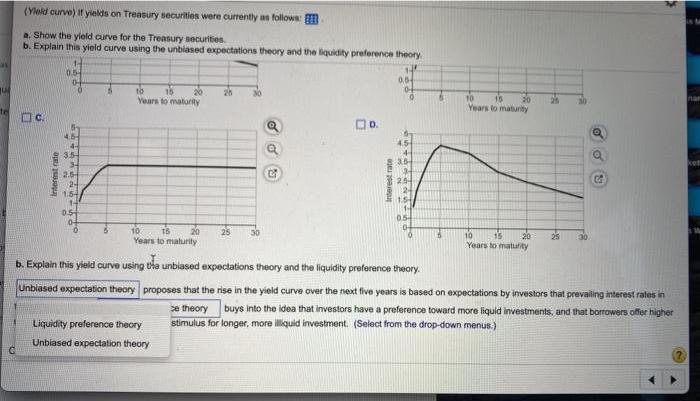
a. Show the yield curve for the Treasury securities. b. Explain this yield curve using the unbiased expectations theory and the liquidity preference theory. a. Which of the following graphs shows the yield curve for the Treasury securities? (Select the best choice below.) OA. 4.54 3.5- 3.5 25 15 1.5- 0. 0.5- 10 15 Years to maturity 25 20 30 15 Years to maturity 10 20 30 OC. O D. 4. 4- 35 35- 2.5 24 15 1.54 Interest rate interest rate 53 (Vield curve) If yields on Treasury securities were currently as follows: a. Show the yleld curve for the Treasury securities. b. Explain this yield curve using the unblased expectations theory and the liquidity preference theory 0.5- 0.5 0. to Years to maturity 15 28 10 Years to maturity 20 25 30 nan OC. 4.5- 4- 3.5 3- 2.6 24 1.5- 4.54 354 2.5 15 05 054 10 20 30 10 15 20 25 30 Years to maturity Years to maturity b. Explain this yield curve using tha unbiased expectations theory and the liquidity preference theory. Unbiased expectation theory proposes that the rise in the yield curve over the next five years is based on expectations by investors that prevailing interest rates in se theory buys into the idea that investors have a preference toward more liquid investments, and that borrowers offer higher stimulus for longer, more ilquid investment. (Select from the drop-down menus.) Liquidity preference theory Unbiased expectation theory Interest rate interest rate
Step by Step Solution
3.49 Rating (152 Votes )
There are 3 Steps involved in it
Unbiased expectation theory forward values do not pre... View full answer

Get step-by-step solutions from verified subject matter experts