

Question: The yields for Treasuries with differing maturities on a recent day are shown in the following table. Es a. Select the graph that represents the
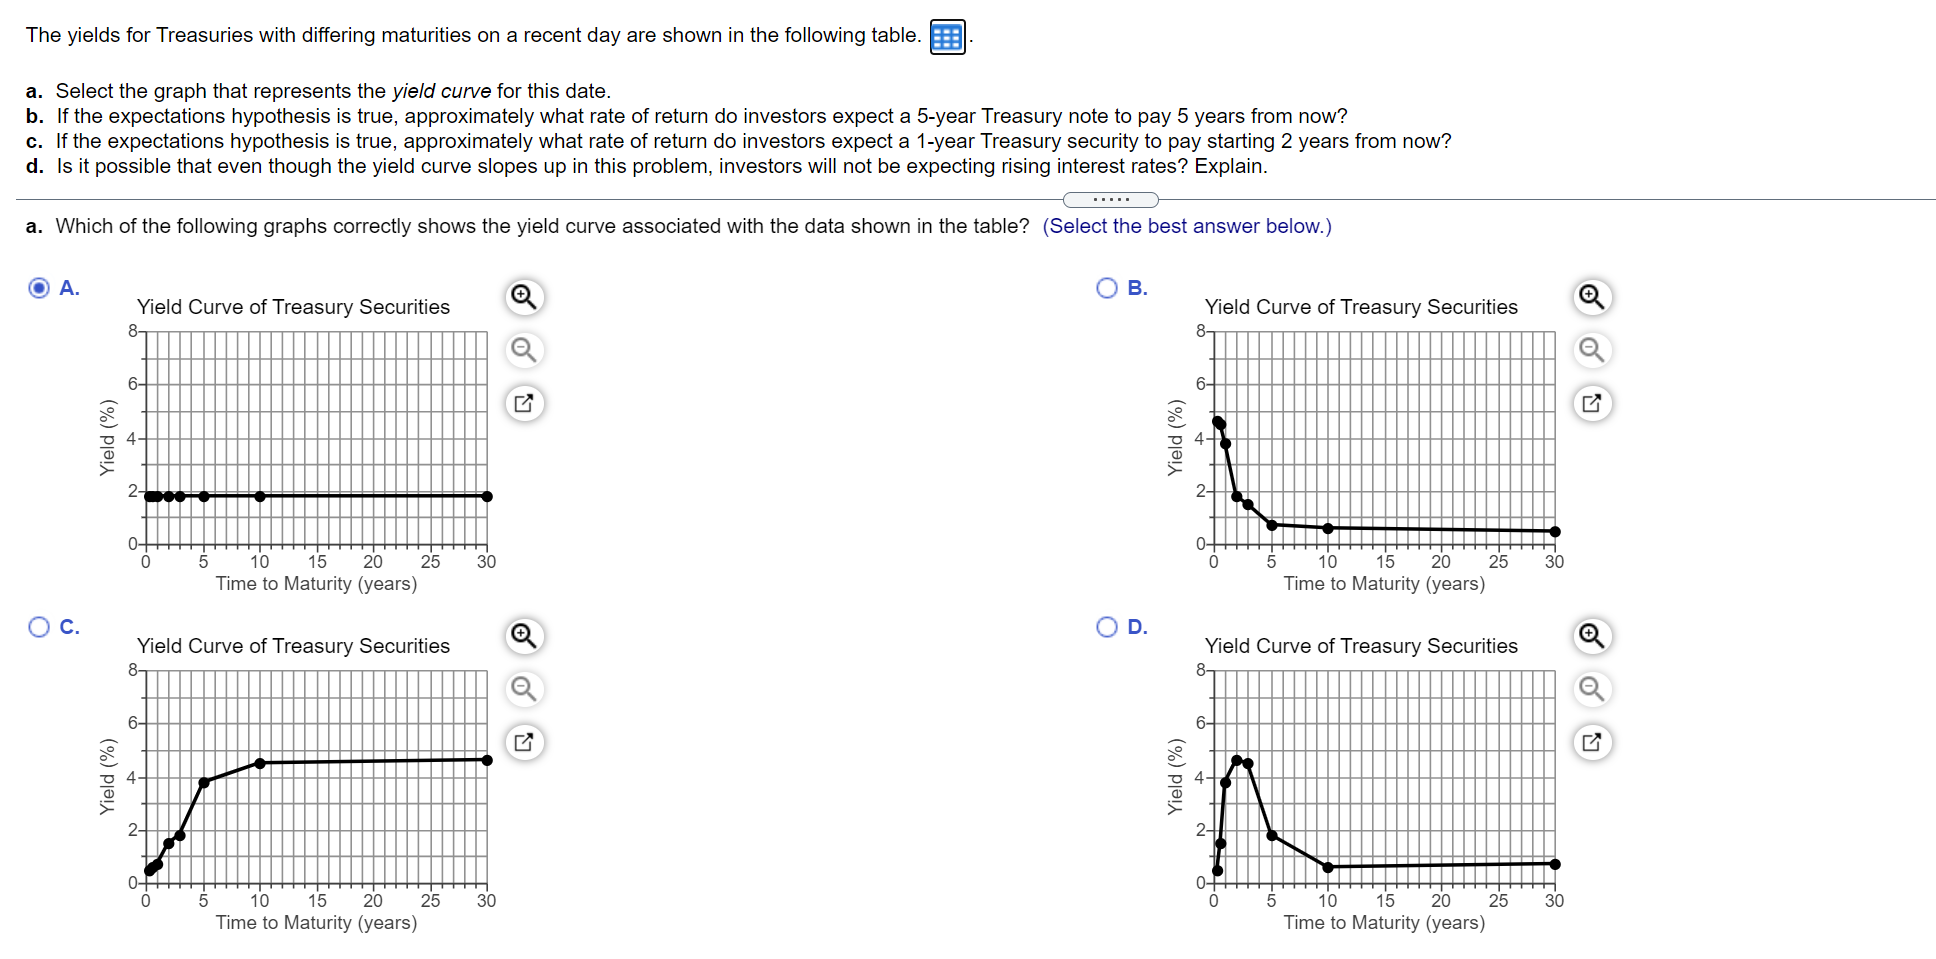
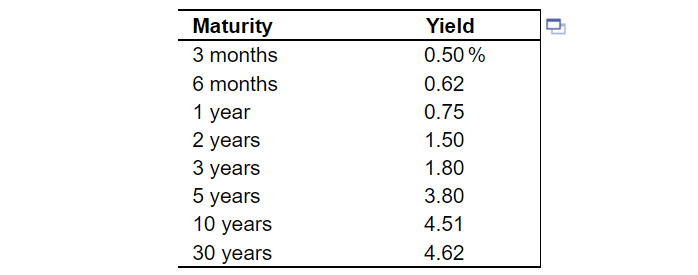
The yields for Treasuries with differing maturities on a recent day are shown in the following table. Es a. Select the graph that represents the yield curve for this date. b. If the expectations hypothesis is true, approximately what rate of return do investors expect a 5-year Treasury note to pay 5 years from now? c. If the expectations hypothesis is true, approximately what rate of return do investors expect a 1-year Treasury security to pay starting 2 years from now? d. Is it possible that even though the yield curve slopes up in this problem, investors will not be expecting rising interest rates? Explain. a. Which of the following graphs correctly shows the yield curve associated with the data shown in the table? (Select the best answer below.) A. B. Yield Curve of Treasury Securities 8 Yield Curve of Treasury Securities 8- 6- 6 Yield (%) Yield (%) 2 0- 30 0 30 5 10 15 20 25 Time to Maturity (years) 5 10 15 20 25 Time to Maturity (years) C. D. Yield Curve of Treasury Securities 8- Yield Curve of Treasury Securities 8- 6- 6- Yield (%) Yield (%) OF 4 0 30 5 10 15 20 25 Time to Maturity (years) OFF 0 5 10 15 20 25 Time to Maturity (years) 30 Maturity 3 months 6 months 1 year 2 years 3 years 5 years 10 years 30 years Yield 0.50 % 0.62 0.75 1.50 1.80 3.80 4.51 4.62
Step by Step Solution
There are 3 Steps involved in it

Get step-by-step solutions from verified subject matter experts