

Question: Explain what is shown/how it is shown in the Tool's information column of the tables. Application Monitoring Tasks Task Processor running program Amount of cache
Explain what is shown/how it is shown in the Tool's information column of the tables.
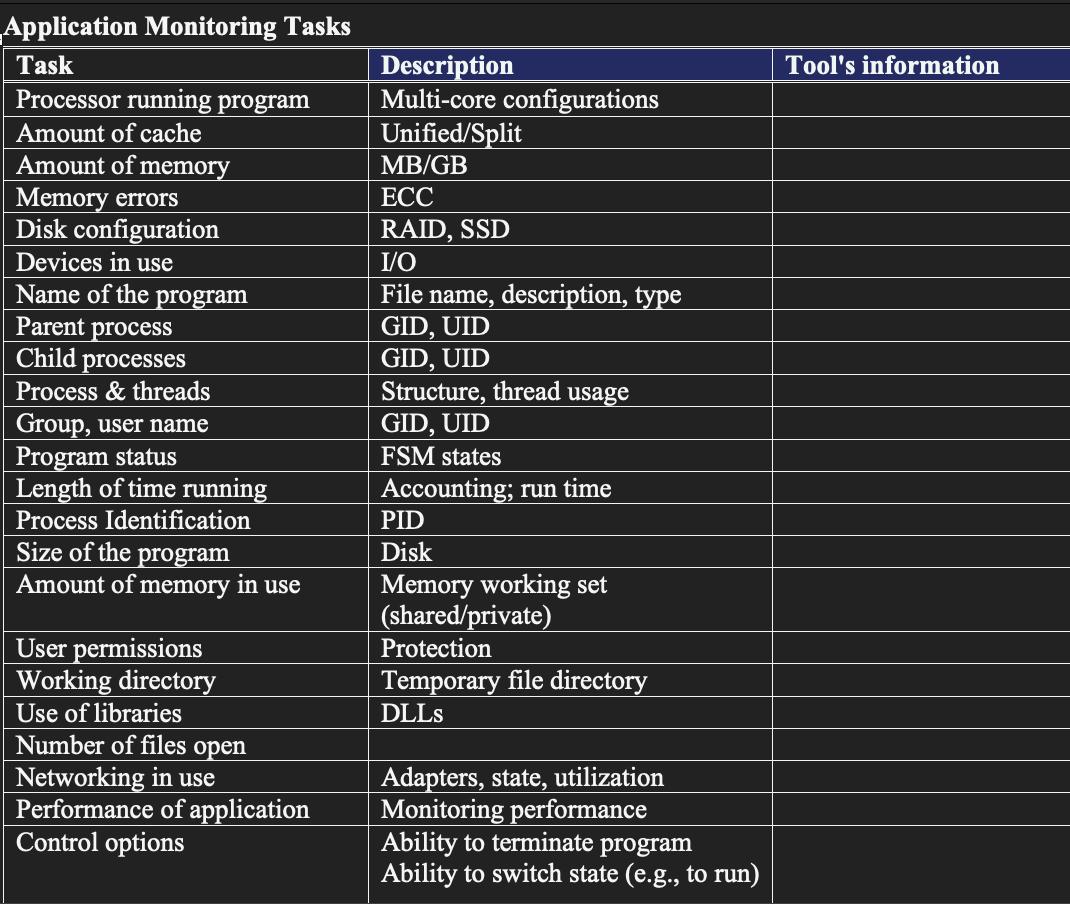
Application Monitoring Tasks Task Processor running program Amount of cache Amount of memory Memory errors Disk configuration Devices in use Name of the program Parent process Child processes Process & threads Group, user name Program status Length of time running Process Identification Size of the program Amount of memory in use User permissions Working directory Use of libraries Number of files open Networking in use Performance of application Control options Description Multi-core configurations Unified/Split MB/GB ECC RAID, SSD I/O File name, description, type GID, UID GID, UID Structure, thread GID, UID FSM states Accounting; run time usage PID Disk Memory working set (shared/private) Protection Temporary file directory DLLs Adapters, state, utilization Monitoring performance Ability to terminate program Ability to switch state (e.g., to run) Tool's information
Step by Step Solution
There are 3 Steps involved in it
The Tools information column of the tables shows the name of the tool the description of the task an... View full answer

Get step-by-step solutions from verified subject matter experts