

Question: Explain what we learn from Table 7.2. E(r) (%) SML Stock ali 17 15.6 14 M s 6 - - B 3 1.0 1.2 Figure
Explain what we learn from Table 7.2.
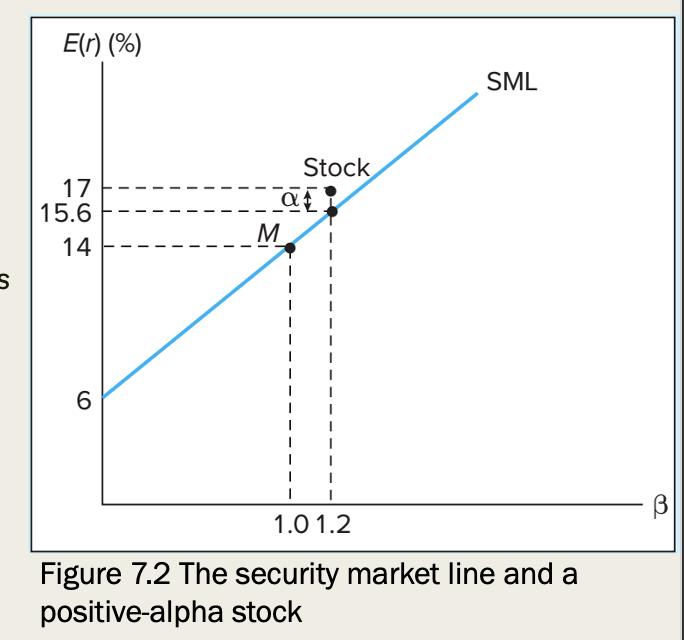
E(r) (%) SML Stock ali 17 15.6 14 M s 6 - - B 3 1.0 1.2 Figure 7.2 The security market line and a positive-alpha stock
Step by Step Solution
There are 3 Steps involved in it
1 Expert Approved Answer
Step: 1 Unlock

Question Has Been Solved by an Expert!
Get step-by-step solutions from verified subject matter experts
Step: 2 Unlock
Step: 3 Unlock