

Question: Explain what would a comparative analysis of the current year forecast vs Year 1 budget look like from the chart above? Current Year Forecast and
Explain what would a comparative analysis of the current year forecast vs Year 1 budget look like from the chart above?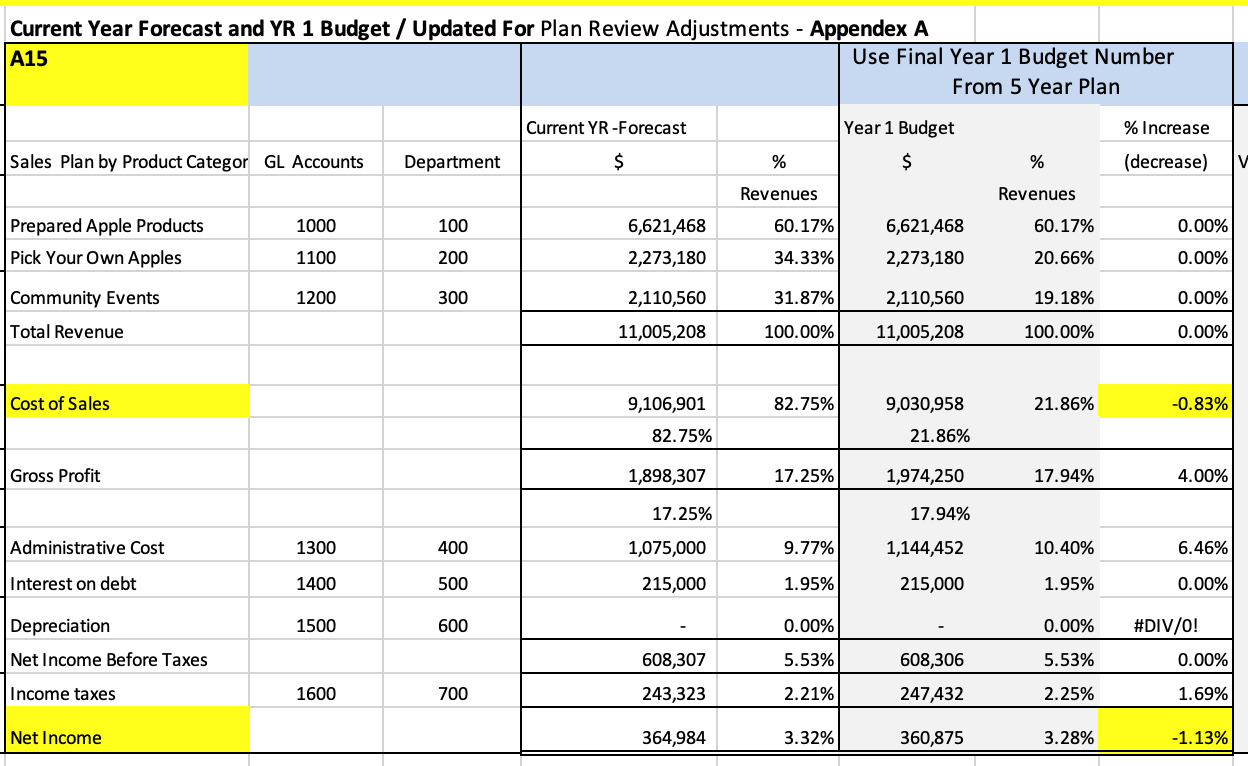
Current Year Forecast and YR 1 Budget / Updated For Plan Review Adjustments - Appendex A A15 Sales Plan by Product Categor GL Accounts Prepared Apple Products Pick Your Own Apples Community Events Total Revenue Cost of Sales Gross Profit Administrative Cost Interest on debt Depreciation Net Income Before Taxes Income taxes Net Income 1000 1100 1200 1300 1400 1500 1600 Department 100 200 300 400 500 600 700 Current YR -Forecast $ 6,621,468 2,273,180 2,110,560 11,005,208 9,106,901 82.75% 1,898,307 17.25% 1,075,000 215,000 608,307 243,323 364,984 % Revenues 60.17% 34.33% 31.87% 100.00% 82.75% 17.25% 9.77% 1.95% 0.00% 5.53% 2.21% 3.32% Use Final Year 1 Budget Number From 5 Year Plan Year 1 Budget $ 6,621,468 2,273,180 2,110,560 11,005,208 9,030,958 21.86% 1,974,250 17.94% 1,144,452 215,000 608,306 247,432 360,875 % Revenues 60.17% 20.66% 19.18% 100.00% 21.86% 17.94% 10.40% 1.95% % Increase (decrease) 3.28% 0.00% 0.00% 0.00% 0.00% -0.83% 4.00% 6.46% 0.00% 0.00% #DIV/0! 5.53% 2.25% 0.00% 1.69% -1.13% V
Step by Step Solution
There are 3 Steps involved in it
A comparative analysis of the current year forecast vs Year 1 budget based on the provided chart would involve examining the projected figures for rev... View full answer

Get step-by-step solutions from verified subject matter experts