Question: explain why this heat map and spark-lines chart is good to communicating the trend of revenues over the six months for each company.. please type

explain why this heat map and spark-lines chart is good to communicating the trend of revenues over the six months for each company..
please type thank you explain why this heat map and spark-lines chart
B D E F G H 1 Company 3 Blue Sky Media 4 Innovate Technologies s Timmler Company 6 Accelerate, Inc. 7 Allen and Davis, LLC 8 Smith Ventures 9 Jan 8995 18250 8480 28325 4580 17500 Feb 9285 16870 7650 27580 6420 16850 Revenue (S) Mar Apr 11555 9530 19580 17260 7023 6540 23450 22500 6780 7520 20185 18950 May 11230 18290 5700 20800 8370 17520 Jun 13600 16250 4930 19800 10100 18580 1337/13 10 11 12 13 14 15 16 17

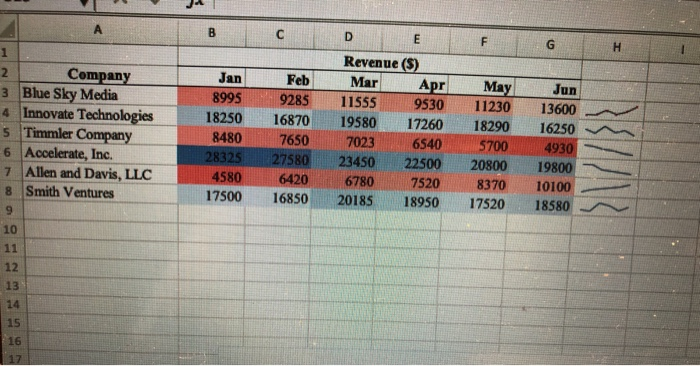
Step by Step Solution

There are 3 Steps involved in it

1 Expert Approved Answer
Step: 1 Unlock blur-text-image
Question Has Been Solved by an Expert!

Get step-by-step solutions from verified subject matter experts

Step: 2 Unlock
Step: 3 Unlock

Students Have Also Explored These Related General Management Questions!