

Question: Explain why you selected the previous answer. Explain why the price level and output/real GDP changed. See question below: LRAS P, Natural Level Of Output

Explain why you selected the previous answer. Explain why the price level and output/real GDP changed.
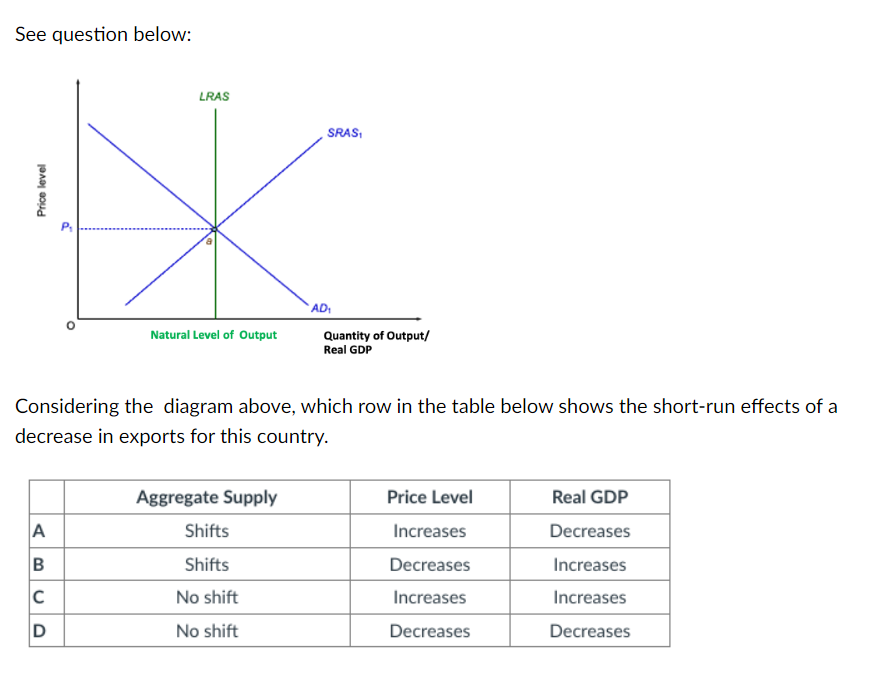
See question below: LRAS P, Natural Level Of Output SMS, Quantity of Output/ Real GDP Considering the diagram above, which row in the table below shows the short-run effects of a decrease in exports for this country. c Aggregate Supply Shifts Shifts No shift No shift Price Level Increases Decreases Increases Decreases Real GDP Decreases Increases Increases Decreases
Step by Step Solution
There are 3 Steps involved in it
1 Expert Approved Answer
Step: 1 Unlock

Question Has Been Solved by an Expert!
Get step-by-step solutions from verified subject matter experts
Step: 2 Unlock
Step: 3 Unlock