Question: Explain with Formulas YOU Would like to determine the expected duration and variance for the project's seven activities named AO G. able + mas the
Explain with Formulas
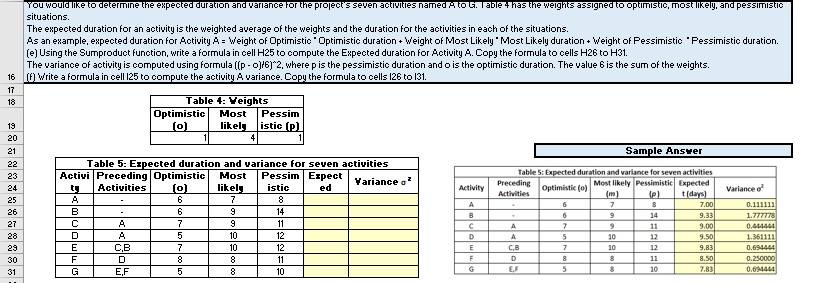
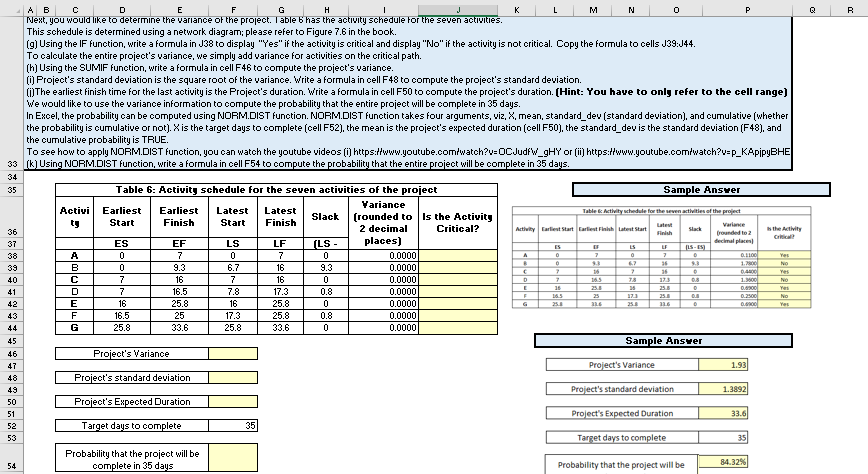
YOU Would like to determine the expected duration and variance for the project's seven activities named AO G. able + mas the weights assigned to optimistic, most likely, and pessimistIC situations The expected duration for an activity is the weighted average of the weights and the duration for the activities in each of the situations. As an example, expected duration for Activity A = Weight of Optimistic Optimistic duration Weight of Most Likely "Most Likely duration + Weight of Pessimistic 'Pessimistic duration. (e) Using the Sumproduct function, write a formula in cell H25 to compute the Expected duration for Activity A. Copy the formula to cells H26 to H31. The variance of activity is computed using formula (IP-)/6)2, where p is the pessimistic duration and o is the optimistic duration. The value 6 is the sum of the weights. 16 in Write a formula in cell 125 to compute the activity A variance. Copy the formula to cells 126 to 131. 17 18 Table 4: Veights Optimistic Most Pessim o) likely istic (p) 4 Sample Answer Activity Variance o 19 20 21 22 23 24 25 26 27 28 29 30 31 A B - Table 5: Expected duration and variance for seven activities Activi Preceding Optimistic Most Pessim Expect Variance ? ty Activities (o) istic likely ed A 6 7 8 B 6 9 14 C A 7 9 11 D 5 10 12 E C,B 7 10 12 F 8 8 11 G EF 5 8 10 Table 5: Expected duration and variance for seven activities Preceding Optimistic (0) Most likely Pessimistic Expected Activities le) tidays 6 7 8 7.00 6 9 14 9.33 A 7 9 11 9.00 A 5 10 12 9.50 . 7 10 12 9.83 D 8 8 11 8.50 EF 5 10 7.831 C. D E F G 0.111111 1.777778 0.44444 1.361111 0.694444 0.250000 0.694464 D E F H 1 j L M N P Q R ABC G Next, you would like to determine the variance of the project. Table 6 has the activity schedule for the seven activities. This schedule is determined using a network diagram; please refer to Figure 7.6 in the book. (9) Using the IF function, write a formula in J38 to display "Yes" if the activity is critical and display "No" if the activity is not critical. Copy the formula to cells J39:J44. To calculate the entire project's variance, we simply add variance for activities on the critical path. (h) Using the SUMIF function, write a formula in cell F46 to compute the project's variance. (0) Project's standard deviation is the square root of the variance. Write a formula in cell F48 to compute the project's standard deviation. The earliest finish time for the last activity is the Project's duration. Write a formula in cell F50 to compute the project's duration. (Hint: You have to only refer to the cell range) We would like to use the variance information to compute the probability that the entire project will be complete in 35 days. In Excel, the probability can be computed using NORM.DIST function. NORM.DIST function takes four arguments, viz. X, mean, standard_dev (standard deviation), and cumulative (whether the probability is cumulative or not). X is the target days to complete (cell F52), the mean is the project's expected duration (cell F50), the standard_dev is the standard deviation (F48), and the cumulative probability is TRUE. To see how to apply NORM.DIST function, you can watch the youtube videos (0) https://www.youtube.com/watch?v=OCJudfw_9HY or (b) https://www.youtube.com/watch?v=p_KAPPYBHE 33 (k) Using NORM.DIST function, write a formula in cell F54 to compute the probability that the entire project will be complete in 35 days. 34 35 Sample Answer Activi the Activity Table 6: Activity schedule for the seven activities of the project Variance Earliest Earliest Latest Latest Slack (rounded to Is the Activity Start Finish Start Finish 2 decimal Critical? ES EF LS LF (LS- places) 0 7 0 7 0 0.0000 0 9.3 6.7 16 9.3 0.0000 7 16 7 16 0 0.0000 7 16.5 7.8 17.3 0.8 0.0000 16 25.8 16 25.8 0 0.0000 16.5 25 17.3 25.8 0.8 0.0000 25.8 33.6 25.8 33.6 0 0.0000 A B D E F G Table & Activity schedule for the even activities of the project Activity Tarliest Start Darliest Finch Latest Start Late Slack Variance founded to 2 ES decina pa ES LF A 0 3 7 8 0.1106 0 36 > 16 36 D 7 16.5 78 373 08 1 W 35 233 35 233 . 365 23 123 251 G 25.3 25.1 DO Der LLLL Yes NO Yes NO Yes ho Yes 36 37 38 39 40 41 42 43 44 45 46 47 48 49 50 51 52 53 Sample Answer Project's Variance Project's Variance 1.93 Project's standard deviation Project's standard deviation 1.3892 Project's Expected Duration Project's Expected Duration 33.6 Target days to complete 35 Target days to complete 35 Probability that the project will be complete in 35 days 84.32% 54 Probability that the project will be


