

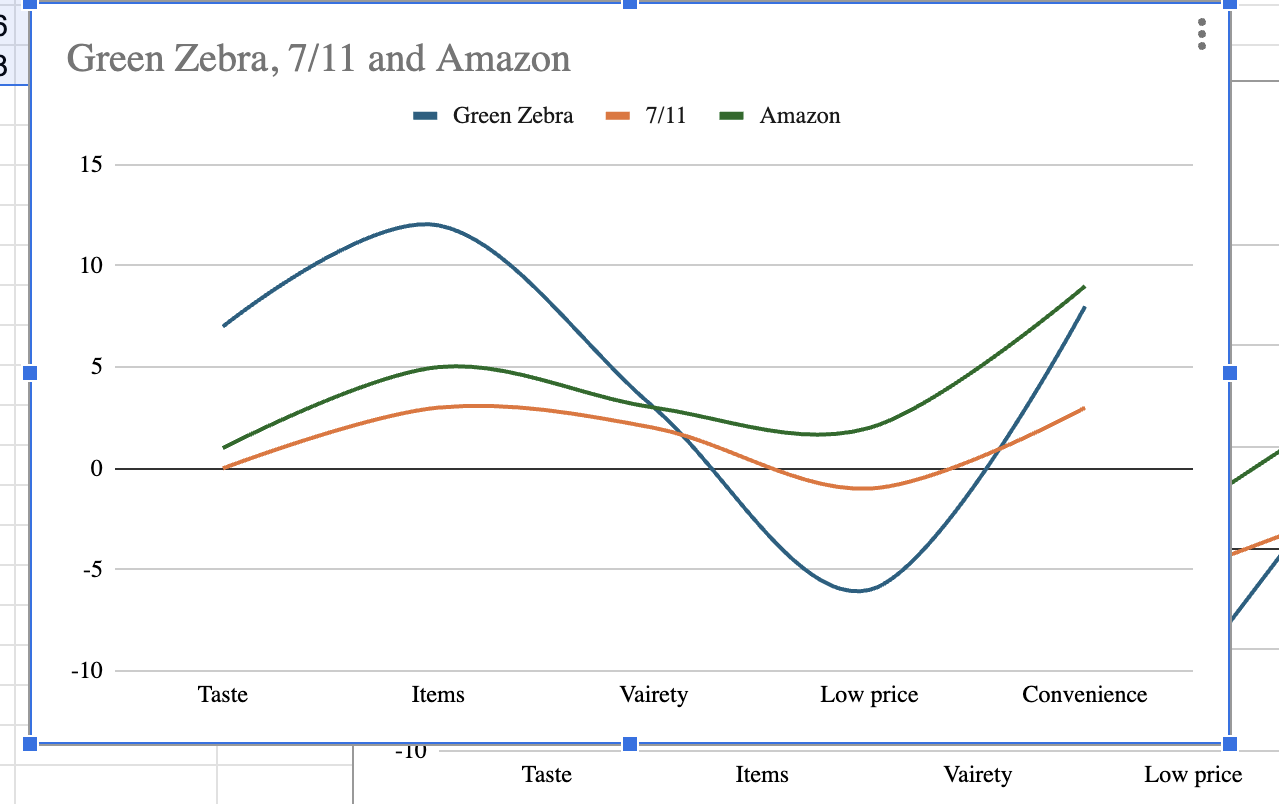
Question: explan this graph ? Green Zebra, 7 / 1 1 and Amazon Green Zebra - 7 / 1 1 Amazon - 1 0 Taste Items
explan this graph Green Zebra, and Amazon
Green Zebra Amazon
Taste
Items
Vairety
Low price
Convenience
Taste
Items
Vairety
Low price
Step by Step Solution
There are 3 Steps involved in it
1 Expert Approved Answer
Step: 1 Unlock

Question Has Been Solved by an Expert!
Get step-by-step solutions from verified subject matter experts
Step: 2 Unlock
Step: 3 Unlock