

Question: Explore the data provided (attached below) to understand the trends, seasonality, and any anomalies that may exist. This includes visualizing the data using plots and
Explore the data provided (attached below) to understand the trends, seasonality, and any anomalies that may exist. This includes visualizing the data using plots and identifying any outliers or missing values. Prepare the data for analysis by performing any necessary data cleaning by transforming the data to make it stationary. This may involve de trending, de seasonalizing, or differencing the data.
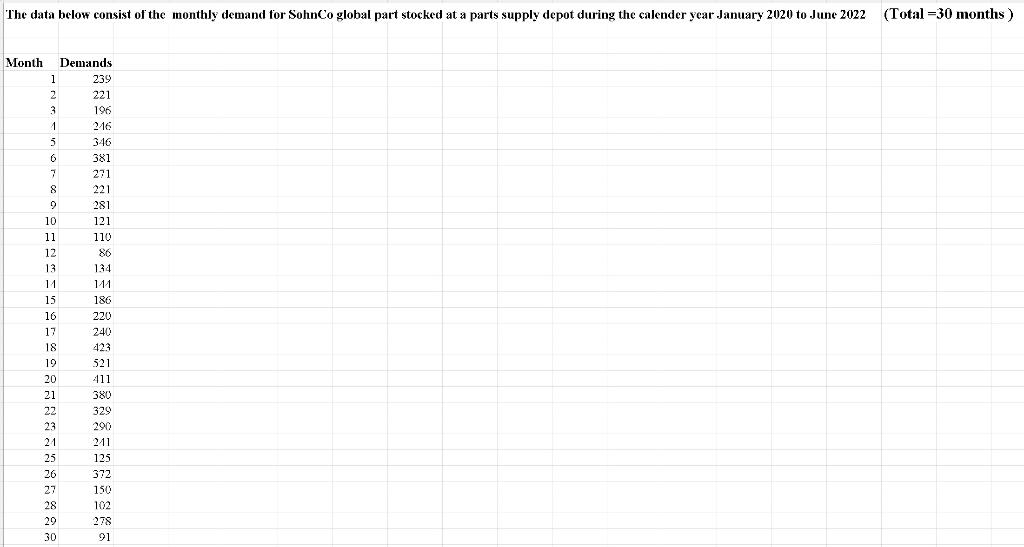
d) Compute and plot the one-step-ahead three months and six months moving average forecasts for the seventh month through the thirtieth month. What effect does increasing N from three to six have on the forecast. What would an MA (1) forecasting method mean? Compare the accuracy of MA (1) forecasts and MA (4) forecasts for seventh month through the thirstiest month. e) Repeat the calculation using exponential smoothing and allow the smoothing constant alpha () to be variable. That is the smoothing constant should be a cell location. By experimenting with different values of alpha, determine MAD, MSE, MAPE. (NB: Assume that the forecast for month 1 is 225).
f) Compare and contrast exponential smoothing when alpha () is near zero (small) and when alpha () is large close to one. Plot the graph
( Total =30
Step by Step Solution
There are 3 Steps involved in it

Get step-by-step solutions from verified subject matter experts