

Question: Exploring the BCTechnology dashboard Which month had the greatest amount of revenue? How much revenue in that month? (Hint: hover the cursor on the trend
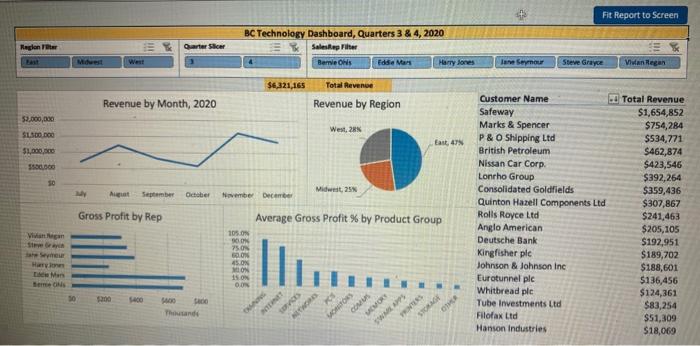
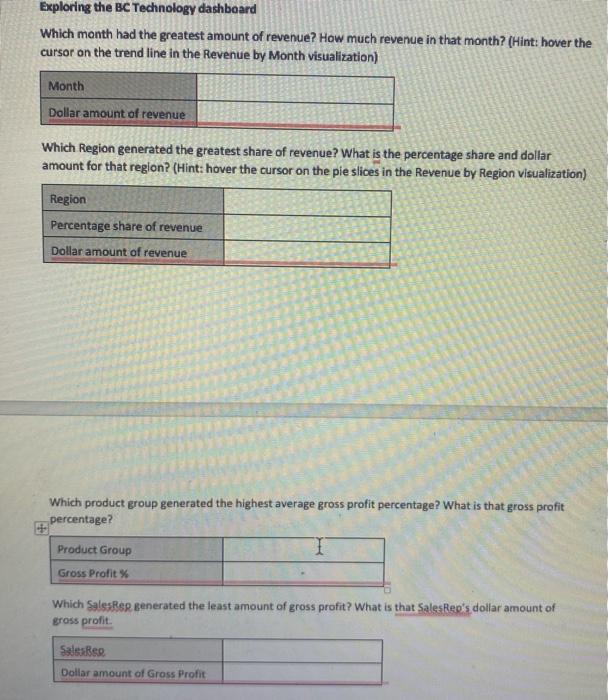
Exploring the BCTechnology dashboard Which month had the greatest amount of revenue? How much revenue in that month? (Hint: hover the cursor on the trend line in the Revenue by Month visualization) Which Region generated the greatest share of revenue? What is the percentage share and dollar amount for that region? (Hint: hover the cursor on the pie slices in the Revenue by Region visualization) Which product group generated the highest average gross profit percentage? What is that gross profit percentage? Which Salsskep generated the least amount of gross profit? What is that Salespep's dollar amount of gross profit. Exploring the BCTechnology dashboard Which month had the greatest amount of revenue? How much revenue in that month? (Hint: hover the cursor on the trend line in the Revenue by Month visualization) Which Region generated the greatest share of revenue? What is the percentage share and dollar amount for that region? (Hint: hover the cursor on the pie slices in the Revenue by Region visualization) Which product group generated the highest average gross profit percentage? What is that gross profit percentage? Which Salsskep generated the least amount of gross profit? What is that Salespep's dollar amount of gross profit
Step by Step Solution
There are 3 Steps involved in it

Get step-by-step solutions from verified subject matter experts