

Question: Exponential growth functions increase at an increasing rate. We can observe this by calculating the average rate of change on different intervals of the function.
Exponential growth functions increase at an increasing rate. We can observe this by calculating the average rate of change on different intervals of the function. [You may want to refer to Section 2.4 to review average rate of change].
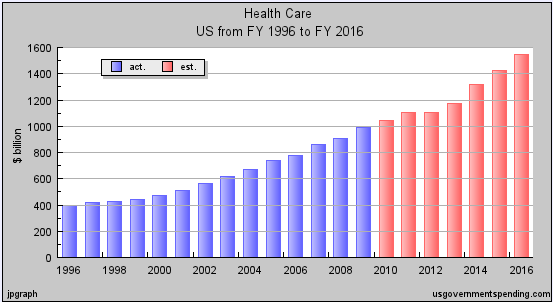
The graph models healthcare spending by the U.S. Government.
Estimating from the graph, it would appear they-value is 1580 in 2016, 790 in 2006, and 400 in 1996.
We first calculate the slope of the straight line that would connect the points (1996,400) and (2006,790).
(790 - 400)/(2006 - 1996) = 390/10 = 39 billion dollars per year.
Now the slope of the straight line that would connect the points (2016,1580) and (2006,790).
(1580 - 790)/(2016 - 2006) = 790/10 = 79 billion dollars per year.
These areaverage annual rates of change. Theaverage annualincreasein health care expense went from $39 billion per year on the interval (1996,2006) to $79 billion per year on the interval (2006,2016).The rate of increasedoubled.
Step by Step Solution
There are 3 Steps involved in it

Get step-by-step solutions from verified subject matter experts