

Question: Express all the above estimators as B1 plus some additional terms Then, consider the expected value of each of these estimators, and using the implications
Express all the above estimators as B1 plus some additional terms
Then, consider the expected value of each of these estimators, and using the implications of E(u/X) =0, determine if each of the above is in general(i.e. without any additional assumptions) an unbiased estimator of B1
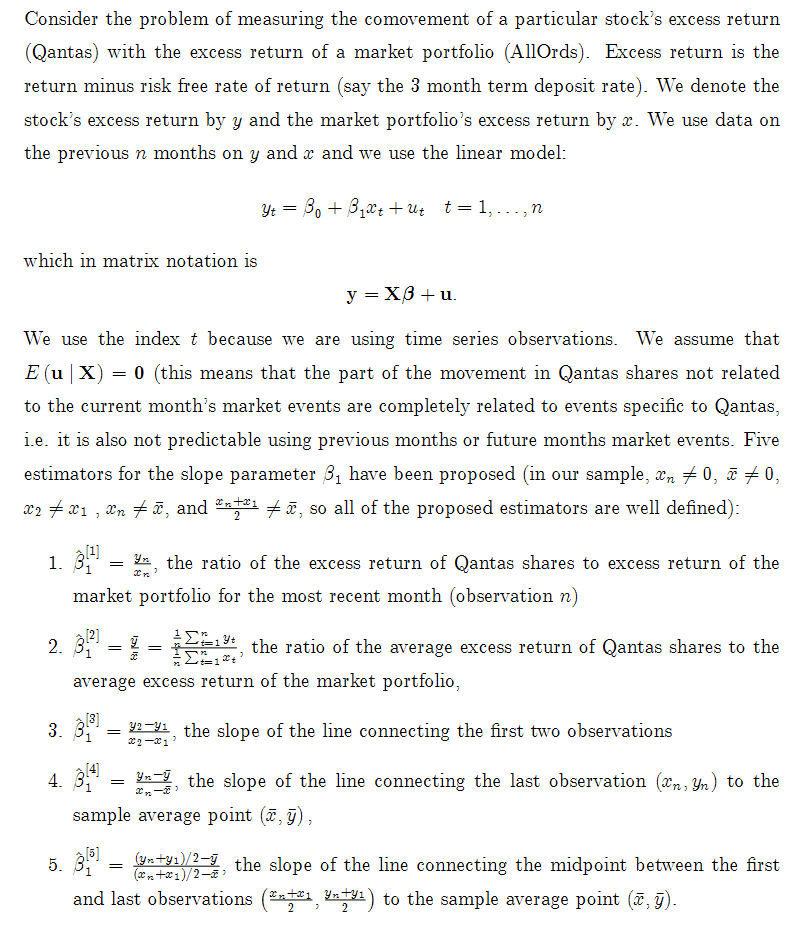
Consider the problem of measuring the comovement of a particular stock's excess return (Qantas) with the excess return of a market portfolio (AllOrds). Excess return is the return minus risk free rate of return (say the 3 month term deposit rate). We denote the stock's excess return by y and the market portfolio's excess return by x. We use data on the previous n months on y and x and we use the linear model: Yt = 30 + 3,2+ +ut t=1, n which in matrix notation is y = X3 + u. We use the index t because we are using time series observations. We assume that E (u | X) = 0 (this means that the part of the movement in Qantas shares not related to the current month's market events are completely related to events specific to Qantas, i.e. it is also not predictable using previous months or future months market events. Five estimators for the slope parameter 3, have been proposed (in our sample, Xn + 0,2 = 0, x2 + x1, Un + T, and ****1 7, so all of the proposed estimators are well defined): 1. 2 the ratio of the excess return of Qantas shares to excess return of the market portfolio for the most recent month (observation n) 2.319 = 1 r, the ratio of the average excess return of Qantas shares to the average excess return of the market portfolio, 3. 3/1 = y2-yu, the slope of the line connecting the first two observations 4.3441= the slope of the line connecting the last observation (2n, 3r) to the sample average point (7,5), 5.31= (yn+ya)/2=1, the slope of the line connecting the midpoint between the first and last observations (mmten Yn ty1) to the sample average point (cy). 22-01 Consider the problem of measuring the comovement of a particular stock's excess return (Qantas) with the excess return of a market portfolio (AllOrds). Excess return is the return minus risk free rate of return (say the 3 month term deposit rate). We denote the stock's excess return by y and the market portfolio's excess return by x. We use data on the previous n months on y and x and we use the linear model: Yt = 30 + 3,2+ +ut t=1, n which in matrix notation is y = X3 + u. We use the index t because we are using time series observations. We assume that E (u | X) = 0 (this means that the part of the movement in Qantas shares not related to the current month's market events are completely related to events specific to Qantas, i.e. it is also not predictable using previous months or future months market events. Five estimators for the slope parameter 3, have been proposed (in our sample, Xn + 0,2 = 0, x2 + x1, Un + T, and ****1 7, so all of the proposed estimators are well defined): 1. 2 the ratio of the excess return of Qantas shares to excess return of the market portfolio for the most recent month (observation n) 2.319 = 1 r, the ratio of the average excess return of Qantas shares to the average excess return of the market portfolio, 3. 3/1 = y2-yu, the slope of the line connecting the first two observations 4.3441= the slope of the line connecting the last observation (2n, 3r) to the sample average point (7,5), 5.31= (yn+ya)/2=1, the slope of the line connecting the midpoint between the first and last observations (mmten Yn ty1) to the sample average point (cy). 22-01
Step by Step Solution
There are 3 Steps involved in it

Get step-by-step solutions from verified subject matter experts