

Question: External Audit Opportunities 1. Competitors, such as Android-based phones, tend to have less control over apps offered to their customers than does Apple. 2. Back
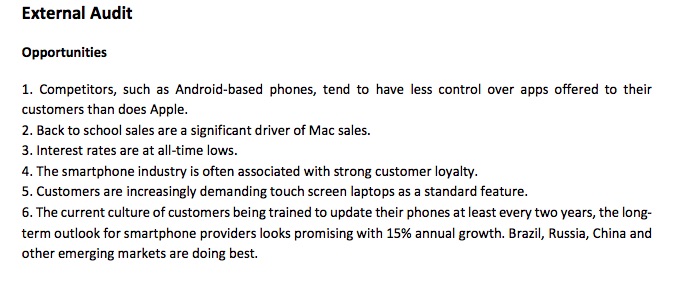
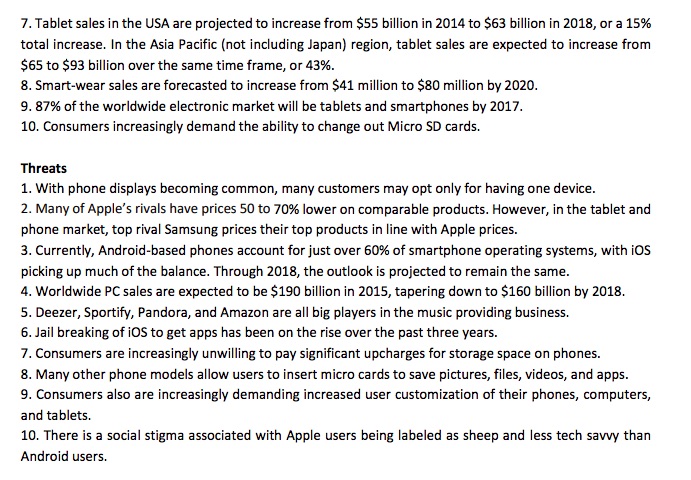
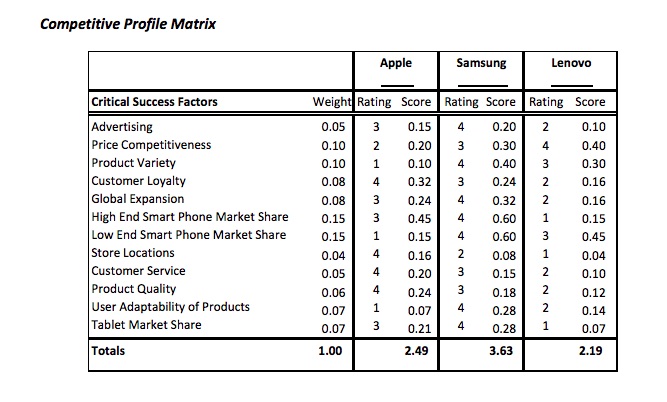
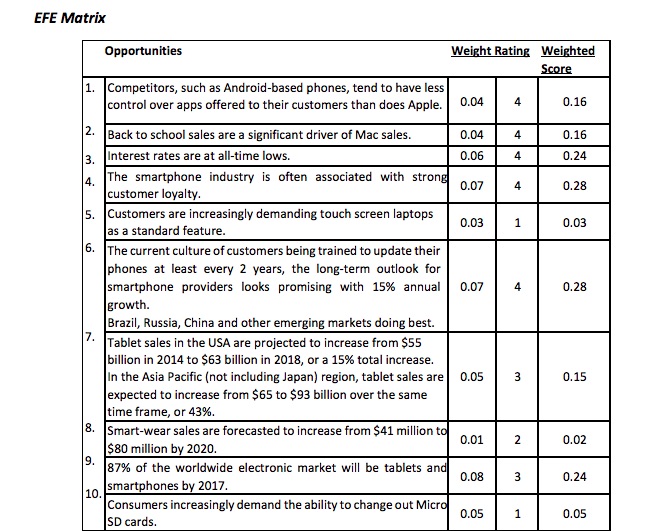
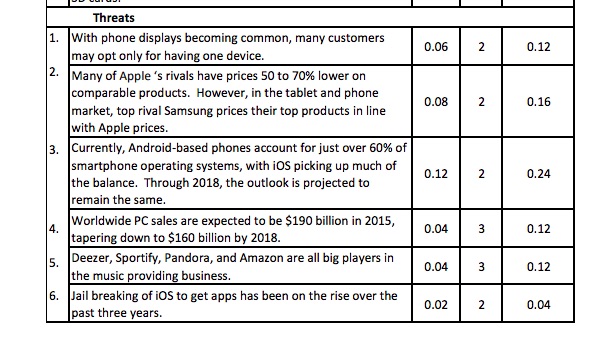
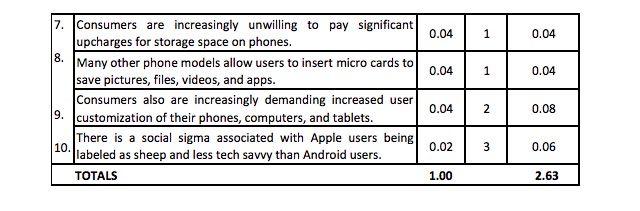
External Audit Opportunities 1. Competitors, such as Android-based phones, tend to have less control over apps offered to their customers than does Apple. 2. Back to school sales are a significant driver of Mac sales. 3. Interest rates are at all-time lows. 4. The smartphone industry is often associated with strong customer loyalty. 5. Customers are increasingly demanding touch screen laptops as a standard feature. 6. The current culture of customers being trained to update their phones at least every two years, the long- term outlook for smartphone providers looks promising with 15% annual growth. Brazil, Russia, China and other emerging markets are doing best.3'. Tablet sales in the USA are projemd to increase from $55 billion in 2014 to 553 billion in 2013, or a 15% total increase. In the Asia Pacic [not including Japan} region, tablet sales are expected to increase from $55 to $93 billion over the same time frame, or 439-6. 8. Smart-wear sales are forecasted to increase from 511-1 million to $30 million by 2020. 5. 32% of the worldwide electronic market will be tablets and sma rtphones by 201 T. 10. Consumers increasingly demand the ability to change out Micro SD cards. Threats 1. With phone displays becoming common, many customers may opt only for having one device. 2. Many of Apple's rivals have prices 50 to 20% lower on comparable products. However, in the tablet and phone market, top rival 5ams ung prices their top products in line with Apple prices. 3. Currently, Android-based phones account for just over 50% of smartp hone operating systems, with iDS picking up much of the balance. Through 2013, the outlook is projected to remain the same. 4. Worldwide PC sales are expected to be $190 billion in 2015, tapering down to $150 billion by 2013. 5. Deemr, Sportify, Pandora, and Amazon are all big players in the music providing business. 6. Jail breaking of iS to get apps has been on the rise over the past three years. 3'. Consumers are increasingly unwilling to pay signicant upcharges for storage space on phones. 3. Many other phone models allow users to insert micro cards to save pictures, files, videos, and apps. 9. Consumers also are increasingly demanding increased user customization of their phones, computers, and tablets. 10. There is a social stigma associated with Apple users being labeled as sheep and less tech savvy than Android users. Competitive Profile Matrix Apple Samsung Lenovo Critical Success Factors Weight Rating Score Rating Score Rating Score Advertising 0.05 0.15 0.20 2 0.10 Price Competitiveness 0.10 2 0.20 0.30 4 0.40 Product Variety 0.10 0.10 4 0.40 0.30 Customer Loyalty 0.08 0.32 0.24 0.16 Global Expansion 0.08 3 0.24 4 0.32 2 0.16 High End Smart Phone Market Share 0.15 0.45 0.60 0.15 Low End Smart Phone Market Share 0.15 0.15 0.60 0.45 Store Locations 0.04 0.16 2 0.08 0.04 Customer Service 0.05 0.20 0.15 0.10 Product Quality 0.06 0.24 0.18 NN 0.12 User Adaptability of Products 0.07 0.07 0.28 0.14 Tablet Market Share 0.07 W H D W 2 0.21 0.28 0.07 Totals 1.00 2.49 3.63 2.19EFE Matrix Opportunities Weight Rating Weighted Score 1. Competitors, such as Android-based phones, tend to have less control over apps offered to their customers than does Apple. 0.04 4 0.16 2. Back to school sales are a significant driver of Mac sales. 0.04 4 0.16 3 Interest rates are at all-time lows. 0.06 0.24 4. The smartphone industry is often associated with strong customer loyalty. 0.07 0.28 5. Customers are increasingly demanding touch screen laptops as a standard feature. 0.03 0.03 6. The current culture of customers being trained to update their phones at least every 2 years, the long-term outlook for smartphone providers looks promising with 15% annual 0.07 4 0.28 growth. Brazil, Russia, China and other emerging markets doing best. 7. Tablet sales in the USA are projected to increase from $55 billion in 2014 to $63 billion in 2018, or a 15% total increase. In the Asia Pacific (not including Japan) region, tablet sales are | 0.05 3 0.15 expected to increase from $65 to $93 billion over the same time frame, or 43%. 8. Smart-wear sales are forecasted to increase from $41 million to $80 million by 2020. 0.01 0.02 9. 87% of the worldwide electronic market will be tablets and 3 smartphones by 2017. 0.08 0.24 10. Consumers increasingly demand the ability to change out Micro SD cards. 0.05 1 0.05Threats 1. With phone displays becoming common, many customers may opt only for having one device. 0.06 2 0.12 2. Many of Apple 's rivals have prices 50 to 70% lower on comparable products. However, in the tablet and phone market, top rival Samsung prices their top products in line 0.08 2 0.16 with Apple prices. 3. Currently, Android-based phones account for just over 60% of smartphone operating systems, with iOS picking up much of the balance. Through 2018, the outlook is projected to 0.12 2 0.24 remain the same. 4. Worldwide PC sales are expected to be $190 billion in 2015, tapering down to $160 billion by 2018. 0.04 3 0.12 5. Deezer, Sportify, Pandora, and Amazon are all big players in the music providing business. 0.04 3 0.12 6. Jail breaking of IOS to get apps has been on the rise over the past three years. 0.02 2 0.047. Consumers are increasingly unwilling to pay significant upcharges for storage space on phones. 0.04 1 0.04 8. Many other phone models allow users to insert micro cards to save pictures, files, videos, and apps. 0.04 1 0.04 Consumers also are increasingly demanding increased user 9. customization of their phones, computers, and tablets. 0.04 2 0.08 10. There is a social sigma associated with Apple users being labeled as sheep and less tech savvy than Android users. 0.02 3 0.06 TOTALS 1.00 2.63
Step by Step Solution
There are 3 Steps involved in it

Get step-by-step solutions from verified subject matter experts