

Question: The table lists weights (pounds) and highway mileage amounts (mpg) for seven automobiles. Use the sample data to construct a scatterplot. use the first
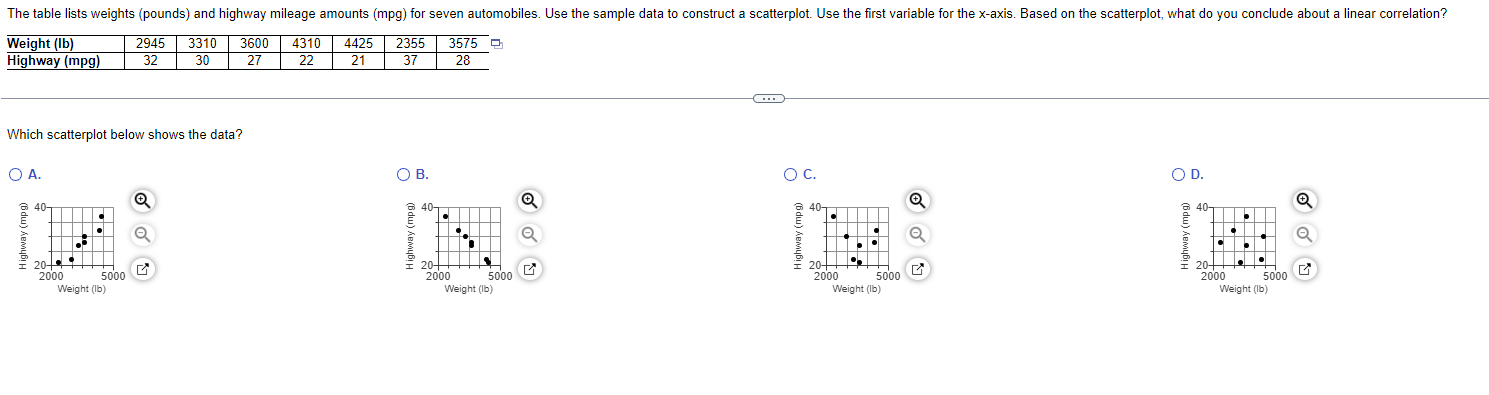

The table lists weights (pounds) and highway mileage amounts (mpg) for seven automobiles. Use the sample data to construct a scatterplot. use the first variable for the x-axis Based on the scatterplot, what do you conclude about a linear correlation? Weight (lb) Highway (mpg) 2946 32 3310 30 3600 27 4310 22 4426 21 2356 37 3675 p, 28 Which scatterplot below shows the data? 2000 sooo 2000 sooo 2000 sooo 2000 sooo Weight (lb) Weight (lb) Weight (lb) Weight (lb)
Step by Step Solution
There are 3 Steps involved in it
1 Expert Approved Answer
Step: 1 Unlock

Question Has Been Solved by an Expert!
Get step-by-step solutions from verified subject matter experts
Step: 2 Unlock
Step: 3 Unlock