

Question: 450 350 250 E 200 150 100 16 18 22 Temperature (t) 26 a. Draw the line of best fit on the scatter graph.

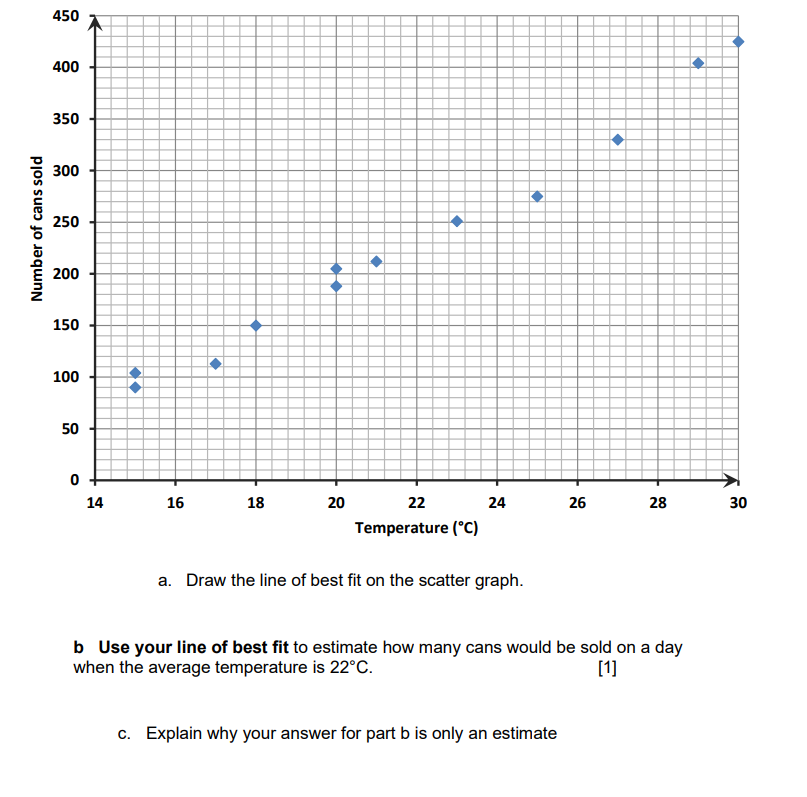
450 350 250 E 200 150 100 16 18 22 Temperature (t) 26 a. Draw the line of best fit on the scatter graph. b Use your line of best fit to estimate how many cans would be sold on a day when the average temperature is 220C. c. Explain why your answer for part b is only an estimate
Step by Step Solution
There are 3 Steps involved in it
1 Expert Approved Answer
Step: 1 Unlock

Question Has Been Solved by an Expert!
Get step-by-step solutions from verified subject matter experts
Step: 2 Unlock
Step: 3 Unlock