

Question: 1. Chapter 7 -- Problems 9, 12, 31, & 55. 2. Use the Excel data file in Canvas for Problems 12, 31, and 55. 3.
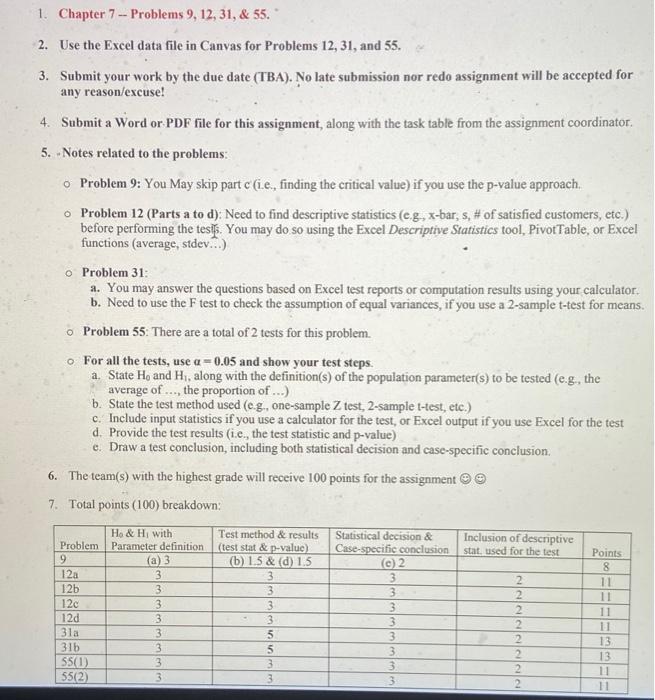
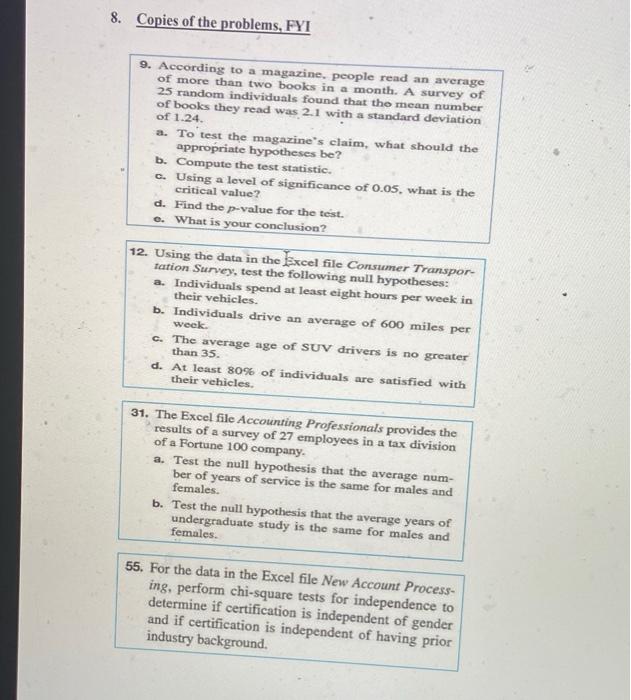
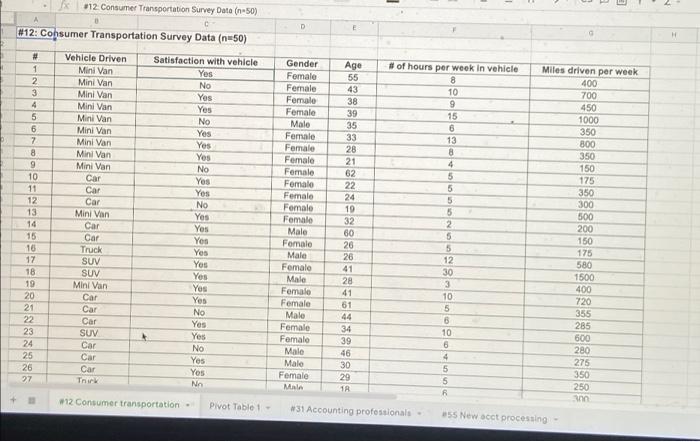
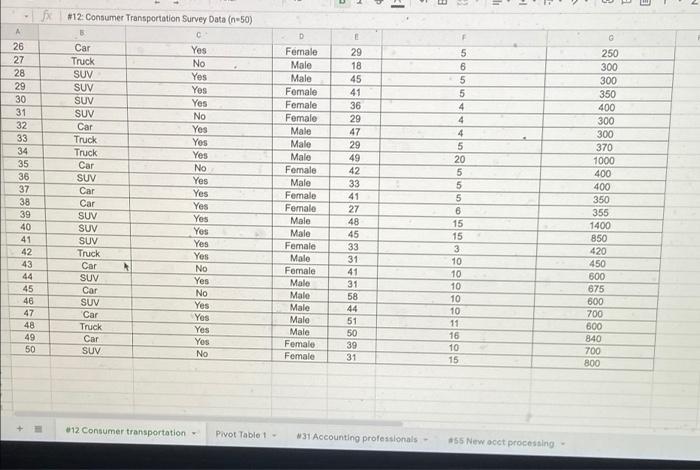
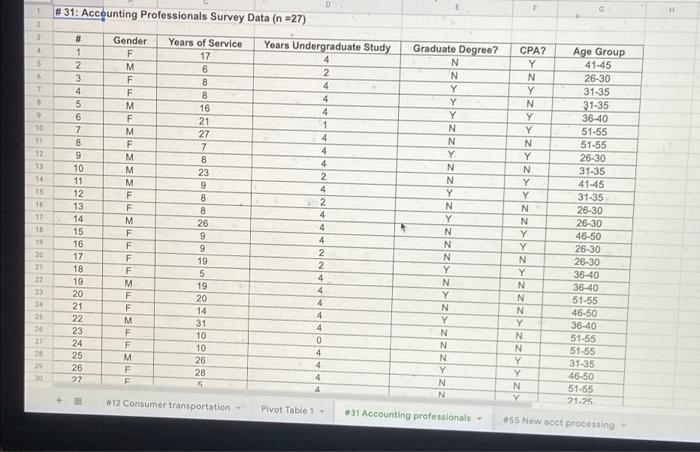
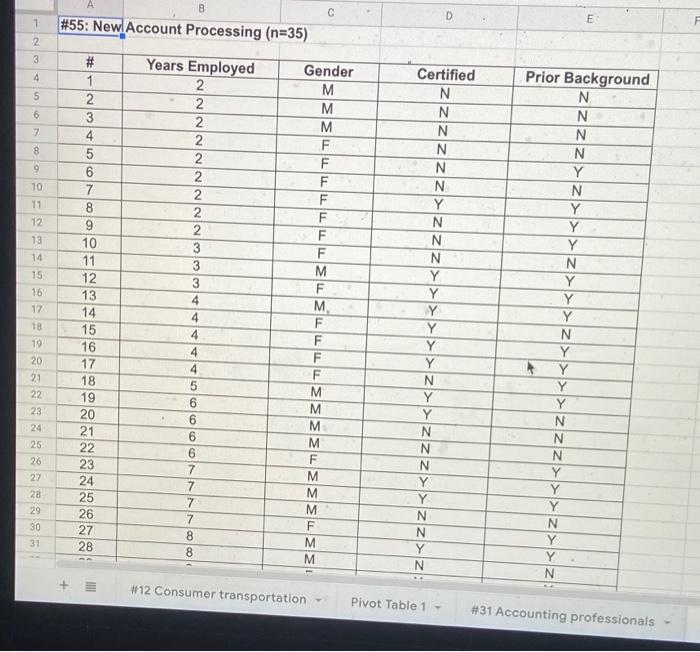
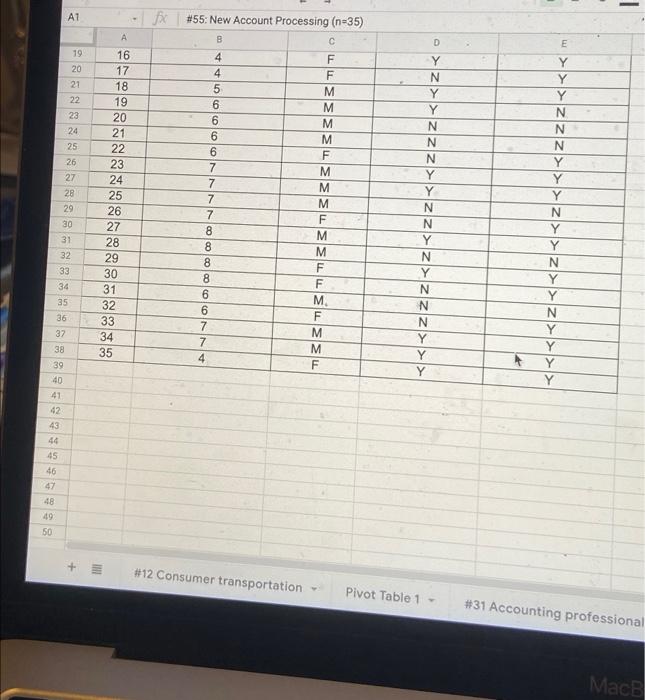
1. Chapter 7 -- Problems 9, 12, 31, & 55. 2. Use the Excel data file in Canvas for Problems 12, 31, and 55. 3. Submit your work by the due date (TBA). No late submission nor redo assignment will be accepted for any reason/excuse! 4. Submit a Word or PDF file for this assignment, along with the task table from the assignment coordinator. 5. Notes related to the problems: o Problem 9: You May skip part c (ie, finding the critical value) if you use the p-value approach. o Problem 12 (Parts a tod). Need to find descriptive statistics (e.g., x-bar, s, # of satisfied customers, etc.) before performing the tesis. You may do so using the Excel Descriptive Statistics tool, PivotTable, or Excel functions (average, stdev...) o Problem 31: a. You may answer the questions based on Excel test reports or computation results using your calculator. b. Need to use the F test to check the assumption of equal variances, if you use a 2-sample t-test for means. Problem 55. There are a total of 2 tests for this problem. For all the tests, use a = 0.05 and show your test steps. a. State Ho and Hy, along with the definition(s) of the population parameter(s) to be tested (eg, the average of ..., the proportion of ...) b. State the test method used (c.g., one-sample Z test, 2-sample t-test, etc.) c. Include input statistics if you use a calculator for the test, or Excel output if you use Excel for the test d. Provide the test results (i.c., the test statistic and p-value) e. Draw a test conclusion, including both statistical decision and case-specific conclusion, 6. The team(s) with the highest grade will receive 100 points for the assignment 7. Total points (100) breakdown: Inclusion of descriptive stat. used for the test Problem 9 12a 12b 12c 12d 31a 315 55(1) 55(2) H. & H, with Parameter definition (a) 3 3 3 3 3 Test method & results (test stat & p-value) (b) 1.5 & (d) 1.5 3 3 3 3 5 3 Statistical decision & Case-specific conclusion (c)2 3 3 3 3 3 3 3 3 2 2 2 2 2 2 2 2 Points 8 11 11 11 11 13 13 11 11 3 cici 8. Copies of the problems, FYI 9. According to a magazine. people read an average of more than two books in a month. A survey of 25 random individuals found that the mean number of books they read was 2.1 with a standard deviation of 1.24. a. To test the magazine's claim, what should the appropriate hypotheses be? b. Compute the test statistic. c. Using a level of significance of 0.05, what is the critical value? d. Find the p-value for the test. e. What is your conclusion? 12. Using the data in the Excel file Consumer Transpor- tation Survey, test the following null hypotheses: a. Individuals spend at least eight hours per week in their vehicles. b. Individuals drive an average of 600 miles per week C. The average age of SUV drivers is no greater than 35. d. At least 80% of individuals are satisfied with their vehicles 31. The Excel file Accounting Professionals provides the results of a survey of 27 employees in a tax division of a Fortune 100 company. a. Test the null hypothesis that the average num- ber of years of service is the same for males and females. b. Test the null hypothesis that the average years of undergraduate study is the same for males and females. 55. For the data in the Excel file New Account Process- ing, perform chi-square tests for independence to determine if certification is independent of gender and if certification is independent of having prior industry background. 912. Consumer Transportation Survey Data (n-50) D #12: Consumer Transportation Survey Data (n=50) H # 1 2 3 4 5 6 7 8 9 10 11 12 13 14 15 16 17 18 19 20 21 22 23 24 25 26 27 Vehicle Driven Mini Van Mini Van Mini Van Mini Van Mini Van Mini Van Mini Van Mini Van Mini Van Car Car Car Mini Van Car Satisfaction with vehicle Yes No Yes Yes No Yes Yes Yes No Yes Yes No Yes Yes Yes Yes Yes Yes Yes Yes No Yes Yes No Yes Yos NO Gender Female Female Female Female Male Female Female Female Female Femalo Female Female Female ale Female Male Female Male Female Female Male Female Female Male Male Female MAA Age 55 43 38 39 35 33 28 21 62 22 24 10 32 60 26 26 41 28 41 61 44 34 39 46 30 29 18 #of hours per week in vehicle 8 10 9 15 6 13 8 4 5 5 5 5 2 5 5 12 30 3 10 5 8 10 6. 4 5 5 R Miles driven per week 400 700 450 1000 350 800 350 150 175 350 300 500 200 150 175 580 1500 400 720 355 285 600 280 275 350 250 Car Truck SUV SUV Mini Van Car Car Car SUV Car Car Car Thi 12 Consumer transportation Pivot Table 1 #31 Accounting professionals 55 New acct processing E -1 3 a 1 1 fx A 26 27 28 29 30 31 32 33 34 35 36 37 38 39 40 41 42 43 44 45 46 47 48 49 50 #12: Consumer Transportation Survey Data (50) C Car Yes Truck No SUV Yes SUV Yes SUV Yes SUV No Car Yes Truck Yos Truck Yes Car No SUV Yes Car Yes Car Yes SUV Yes SUV Yes SUV Yes Truck Yes Car No SUV Yes Car No SUV Yes Car Yos Truck Yes Car Yos SUV No D Female Male Male Female Female Female Male Malo Male Female Male Female Female Male Male Female Male Female Male Male Male Male Male Female Female 29 18 45 41 36 29 47 29 49 42 33 41 27 48 45 33 31 41 31 58 44 51 50 39 31 5 6 5 5 4 4 4 5 20 5 5 5 6 15 15 3 10 10 10 10 10 11 16 10 15 G 250 300 300 350 400 300 300 370 1000 400 400 350 355 1400 850 420 450 600 675 600 700 600 840 700 800 12 Consumer transportation Pivot Tablet - 31 Accounting professionals *55 New acct processing D 1 2 #31: Accounting Professionals Survey Data (n=27) H 2 Years Undergraduate Study 4 3 6 7 Years of Service 17 6 8 8 16 21 27 7 Gender F M F F M F M F M M M F F F ? Y N Y N Y Y N Y N 10 12 13 23 # 1 2. 3 4 5 6 7 8 9 10 11 12 13 14 15 16 17 18 19 20 21 22 23 24 25 26 27 14 15 10 17 10 19 20 (| 10/08/aloe 4 2 4 4 4 1 4 4 4 2 4 2 4 4 4 2 2 4 4 4 4 4 0 | ZZ : : 5 les Y N N Y Y N Y N IN N Y N N Y Y N y 24 25 19 5 19 20 14 31 10 10 26 28 5 F 21 23 4 F F 4 4 30 4 #12 Consumer transportation Pivot Table 1 31 Accounting professionals - #55 New acct processing D 1 B #55: New. Account Processing (n=35) E 2 3 4 5 6 7 9 10 11 12 13 14 15 16 17 18 19 20 21 22 23 # 1 2 3 4 5 6 7 8 9 10 11 12 13 14 15 16 17 18 19 20 21 22 23 24 25 26 27 28 Years Employed 2 2 2 2 2 2 2 2 2 3 3 3 4 4 4 4 4 5 6 6 6 6 7 7 7 7 8 8 Gender M M M F F F F F F F M F . F F F F M M M M F M M F M M Certified N N N N N N Y N N N Y Y Y Y Y Y N Y Y N N N Y Y N N Y N Prior Background N N N N Y N Y Y Y N Y Y Y N Y Y Y Y N N N Y Y Y N Y Y N 24 25 26 27 28 29 30 31 + #12 Consumer transportation Pivot Table 1 #31 Accounting professionals 1 A1 fu #55: New Account Processing (n-35) B D 19 20 21 22 23 24 25 26 27 28 29 A 16 17 18 19 20 21 22 23 24 25 26 27 28 29 30 31 32 33 34 35 4 4 5 6 6 6 6 7 7 7 7 8 8 8 8 F F M M M M F M M M F M M F F M F M M F Y N Y Y N N N Y Y N N Y N Y N N N Y Y E Y Y Y N N N Y Y Y N Y Y N Y Y N Y Y Y Y 30 31 32 33 34 35 36 6-6774 37 38 39 40 41 42 43 44 45 46 47 48 49 50 + #12 Consumer transportation Pivot Table 1 #31 Accounting professional 1. Chapter 7 -- Problems 9, 12, 31, & 55. 2. Use the Excel data file in Canvas for Problems 12, 31, and 55. 3. Submit your work by the due date (TBA). No late submission nor redo assignment will be accepted for any reason/excuse! 4. Submit a Word or PDF file for this assignment, along with the task table from the assignment coordinator. 5. Notes related to the problems: o Problem 9: You May skip part c (ie, finding the critical value) if you use the p-value approach. o Problem 12 (Parts a tod). Need to find descriptive statistics (e.g., x-bar, s, # of satisfied customers, etc.) before performing the tesis. You may do so using the Excel Descriptive Statistics tool, PivotTable, or Excel functions (average, stdev...) o Problem 31: a. You may answer the questions based on Excel test reports or computation results using your calculator. b. Need to use the F test to check the assumption of equal variances, if you use a 2-sample t-test for means. Problem 55. There are a total of 2 tests for this problem. For all the tests, use a = 0.05 and show your test steps. a. State Ho and Hy, along with the definition(s) of the population parameter(s) to be tested (eg, the average of ..., the proportion of ...) b. State the test method used (c.g., one-sample Z test, 2-sample t-test, etc.) c. Include input statistics if you use a calculator for the test, or Excel output if you use Excel for the test d. Provide the test results (i.c., the test statistic and p-value) e. Draw a test conclusion, including both statistical decision and case-specific conclusion, 6. The team(s) with the highest grade will receive 100 points for the assignment 7. Total points (100) breakdown: Inclusion of descriptive stat. used for the test Problem 9 12a 12b 12c 12d 31a 315 55(1) 55(2) H. & H, with Parameter definition (a) 3 3 3 3 3 Test method & results (test stat & p-value) (b) 1.5 & (d) 1.5 3 3 3 3 5 3 Statistical decision & Case-specific conclusion (c)2 3 3 3 3 3 3 3 3 2 2 2 2 2 2 2 2 Points 8 11 11 11 11 13 13 11 11 3 cici 8. Copies of the problems, FYI 9. According to a magazine. people read an average of more than two books in a month. A survey of 25 random individuals found that the mean number of books they read was 2.1 with a standard deviation of 1.24. a. To test the magazine's claim, what should the appropriate hypotheses be? b. Compute the test statistic. c. Using a level of significance of 0.05, what is the critical value? d. Find the p-value for the test. e. What is your conclusion? 12. Using the data in the Excel file Consumer Transpor- tation Survey, test the following null hypotheses: a. Individuals spend at least eight hours per week in their vehicles. b. Individuals drive an average of 600 miles per week C. The average age of SUV drivers is no greater than 35. d. At least 80% of individuals are satisfied with their vehicles 31. The Excel file Accounting Professionals provides the results of a survey of 27 employees in a tax division of a Fortune 100 company. a. Test the null hypothesis that the average num- ber of years of service is the same for males and females. b. Test the null hypothesis that the average years of undergraduate study is the same for males and females. 55. For the data in the Excel file New Account Process- ing, perform chi-square tests for independence to determine if certification is independent of gender and if certification is independent of having prior industry background. 912. Consumer Transportation Survey Data (n-50) D #12: Consumer Transportation Survey Data (n=50) H # 1 2 3 4 5 6 7 8 9 10 11 12 13 14 15 16 17 18 19 20 21 22 23 24 25 26 27 Vehicle Driven Mini Van Mini Van Mini Van Mini Van Mini Van Mini Van Mini Van Mini Van Mini Van Car Car Car Mini Van Car Satisfaction with vehicle Yes No Yes Yes No Yes Yes Yes No Yes Yes No Yes Yes Yes Yes Yes Yes Yes Yes No Yes Yes No Yes Yos NO Gender Female Female Female Female Male Female Female Female Female Femalo Female Female Female ale Female Male Female Male Female Female Male Female Female Male Male Female MAA Age 55 43 38 39 35 33 28 21 62 22 24 10 32 60 26 26 41 28 41 61 44 34 39 46 30 29 18 #of hours per week in vehicle 8 10 9 15 6 13 8 4 5 5 5 5 2 5 5 12 30 3 10 5 8 10 6. 4 5 5 R Miles driven per week 400 700 450 1000 350 800 350 150 175 350 300 500 200 150 175 580 1500 400 720 355 285 600 280 275 350 250 Car Truck SUV SUV Mini Van Car Car Car SUV Car Car Car Thi 12 Consumer transportation Pivot Table 1 #31 Accounting professionals 55 New acct processing E -1 3 a 1 1 fx A 26 27 28 29 30 31 32 33 34 35 36 37 38 39 40 41 42 43 44 45 46 47 48 49 50 #12: Consumer Transportation Survey Data (50) C Car Yes Truck No SUV Yes SUV Yes SUV Yes SUV No Car Yes Truck Yos Truck Yes Car No SUV Yes Car Yes Car Yes SUV Yes SUV Yes SUV Yes Truck Yes Car No SUV Yes Car No SUV Yes Car Yos Truck Yes Car Yos SUV No D Female Male Male Female Female Female Male Malo Male Female Male Female Female Male Male Female Male Female Male Male Male Male Male Female Female 29 18 45 41 36 29 47 29 49 42 33 41 27 48 45 33 31 41 31 58 44 51 50 39 31 5 6 5 5 4 4 4 5 20 5 5 5 6 15 15 3 10 10 10 10 10 11 16 10 15 G 250 300 300 350 400 300 300 370 1000 400 400 350 355 1400 850 420 450 600 675 600 700 600 840 700 800 12 Consumer transportation Pivot Tablet - 31 Accounting professionals *55 New acct processing D 1 2 #31: Accounting Professionals Survey Data (n=27) H 2 Years Undergraduate Study 4 3 6 7 Years of Service 17 6 8 8 16 21 27 7 Gender F M F F M F M F M M M F F F ? Y N Y N Y Y N Y N 10 12 13 23 # 1 2. 3 4 5 6 7 8 9 10 11 12 13 14 15 16 17 18 19 20 21 22 23 24 25 26 27 14 15 10 17 10 19 20 (| 10/08/aloe 4 2 4 4 4 1 4 4 4 2 4 2 4 4 4 2 2 4 4 4 4 4 0 | ZZ : : 5 les Y N N Y Y N Y N IN N Y N N Y Y N y 24 25 19 5 19 20 14 31 10 10 26 28 5 F 21 23 4 F F 4 4 30 4 #12 Consumer transportation Pivot Table 1 31 Accounting professionals - #55 New acct processing D 1 B #55: New. Account Processing (n=35) E 2 3 4 5 6 7 9 10 11 12 13 14 15 16 17 18 19 20 21 22 23 # 1 2 3 4 5 6 7 8 9 10 11 12 13 14 15 16 17 18 19 20 21 22 23 24 25 26 27 28 Years Employed 2 2 2 2 2 2 2 2 2 3 3 3 4 4 4 4 4 5 6 6 6 6 7 7 7 7 8 8 Gender M M M F F F F F F F M F . F F F F M M M M F M M F M M Certified N N N N N N Y N N N Y Y Y Y Y Y N Y Y N N N Y Y N N Y N Prior Background N N N N Y N Y Y Y N Y Y Y N Y Y Y Y N N N Y Y Y N Y Y N 24 25 26 27 28 29 30 31 + #12 Consumer transportation Pivot Table 1 #31 Accounting professionals 1 A1 fu #55: New Account Processing (n-35) B D 19 20 21 22 23 24 25 26 27 28 29 A 16 17 18 19 20 21 22 23 24 25 26 27 28 29 30 31 32 33 34 35 4 4 5 6 6 6 6 7 7 7 7 8 8 8 8 F F M M M M F M M M F M M F F M F M M F Y N Y Y N N N Y Y N N Y N Y N N N Y Y E Y Y Y N N N Y Y Y N Y Y N Y Y N Y Y Y Y 30 31 32 33 34 35 36 6-6774 37 38 39 40 41 42 43 44 45 46 47 48 49 50 + #12 Consumer transportation Pivot Table 1 #31 Accounting professional
Step by Step Solution
There are 3 Steps involved in it

Get step-by-step solutions from verified subject matter experts