

Question: Construct a scatter diagram using the data table to the right This data is from a study comparing the amount ot tar and carbon

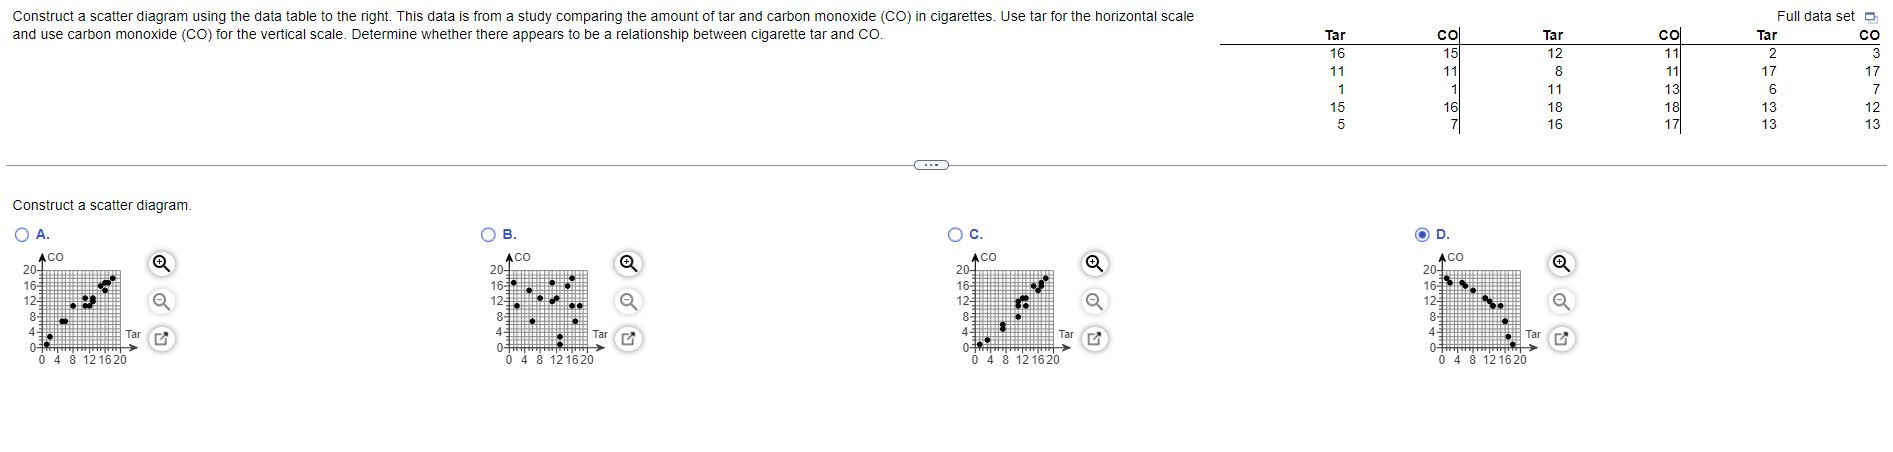
Construct a scatter diagram using the data table to the right This data is from a study comparing the amount ot tar and carbon monoxide (CO) in cigarettes. Use tar for the horizontal scale 04 8 121620 Full data set and use carbon monoxide (CO) tor the vertical scale. Determine whether there appears to be a relationship between cigarette tar and CO. Construct a scatter diagram. Tar 16 11 15 co 15 11 16 Tar 12 11 18 16 11 11 18 Tar 17 13 13 co 17 12 13 048 Tar 121620 Tar 4 8 121620 Tar 8 121620
Step by Step Solution
There are 3 Steps involved in it
1 Expert Approved Answer
Step: 1 Unlock

Question Has Been Solved by an Expert!
Get step-by-step solutions from verified subject matter experts
Step: 2 Unlock
Step: 3 Unlock