

Question: Need some help Construct a scatter diagram using the data table to the right. This data is from a study comparing the amount of tar
Need some help
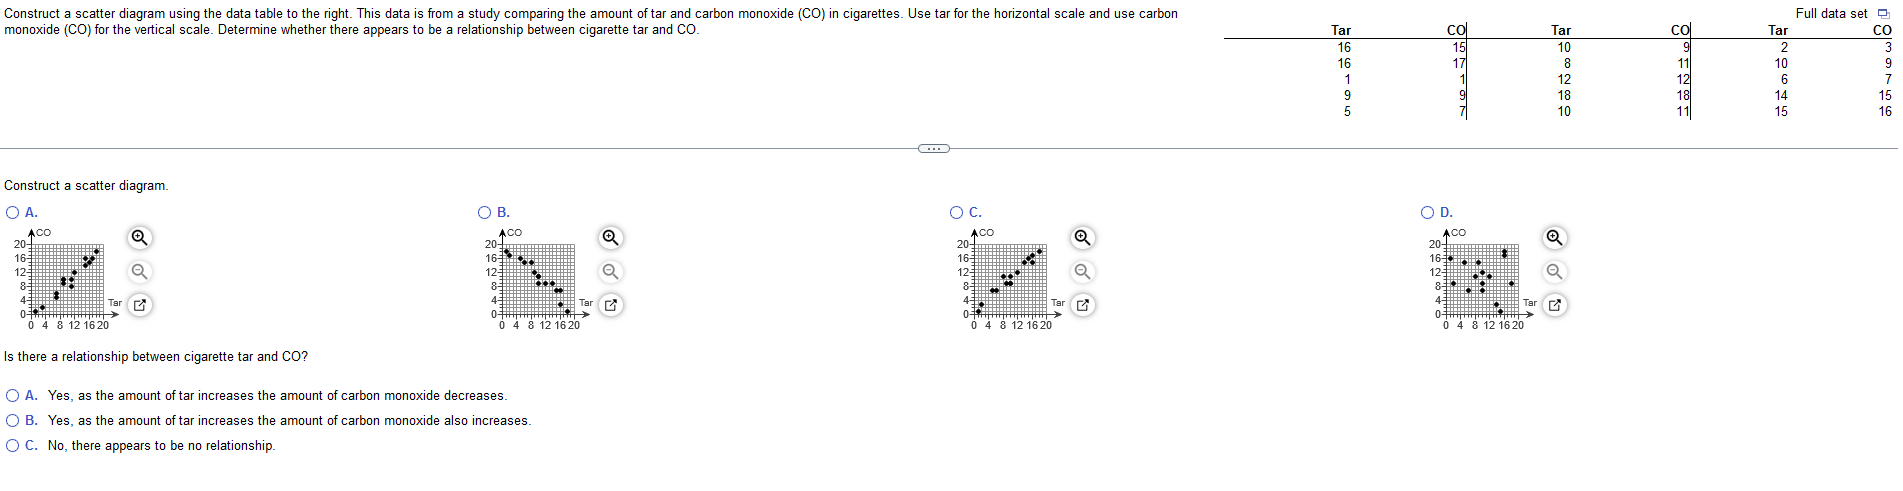
Construct a scatter diagram using the data table to the right. This data is from a study comparing the amount of tar and carbon monoxide (CO) in cigarettes. Use tar for the horizontal scale and use carbon Full data set monoxide (CO) for the vertical scale. Determine whether there appears to be a relationship between cigarette tar and CO. Construct a scatter diagram. O A. O B. DC. D. ACO ACO ACO ACO 16 16 12-# 125 12 C C THATHHHHHHHH > 8 12 16 20 0 4 8 12 1620 0 4 8 12 1620 8 12 16 20 Is there a relationship between cigarette tar and CO? O A. Yes, as the amount of tar increases the amount of carbon monoxide decreases. O B. Yes, as the amount of tar increases the amount of carbon monoxide also increases. O C. No, there appears to be no relationship
Step by Step Solution
There are 3 Steps involved in it

Get step-by-step solutions from verified subject matter experts